 Scan to Download
Trend Trading: Easy Trend following Strategies To Trade With Trends

How many times have you been told to “follow the trend” or “the trend is your friend” in your trading?
Countless times, right?
For many people, these and other related terms have become ear sores because big and small traders keep throwing them around, but never really expound on what they mean.
Well, this annoyance ends today because this article will provide in-depth explanations of trend trading. You will learn what a trend means, how to spot one, and easy strategies to trade with trends.
Are you ready?
What Is A Trend?
In trading, the direction is the element that determines whether you make money or you get kicked in the butt. If you forecast that the GBPUSD forex pair will rise and take the trade, you make money if it goes up. Sadly, if decides to sink, then you lose money.
The direction is everything.
That brings us to our word of the century; trend. What is the trend?
In the simplest definition, a trend is simply an established and sustained direction that the price takes, and which can be easily observed.
If your GBPUSD trade above keeps rising, we say that an uptrend is in progress. Similarly, if it decides to oppose you and keeps sinking we say that a downtrend is in progress.
Start trading with Mitrade today
Get tight spreads, no hidden fees
What Is Trend Trading?
Trend trading, or trend following, is a method and strategy of making money in the trading industry by strictly obeying and adhering to trend directions.
As we might all know, there are hundreds of trading approaches. Some of us trade gaps, others use fundamental analysis, others rely on indicators, some trade candlestick patterns, while others just rely on guesswork and fate.
In our case, though, we are going to focus on trend trading; if the trend goes north, then we follow it. If it decides to go south, then we sink with it.
Trend investing is as simple as that.
Types of Trends In Trading
Trend trading & following are simple, but is it easy?
We can all recall a time when we thought a market was going up, only for it to reverse and meltdown immediately after we executed buy trades.
I guess we can agree that it is not as easy as we might assume.
The simplicity and accuracy of trading with the trend depend on how well a trader can spot and ride them. That said; let us look at the three main trends that exist in our charts. You most probably know them, so we are not going to delve much into them.
However, for the sake of anyone that might not know them, here is a shallow idea of the three main trends found in the markets:
1. Uptrend
We say that we have an uptrend when the price is observed to be going higher and higher. We can look at it as going up a flight of stairs.
See the image below:

In trend investing, we should only take buy trades during an uptrend.
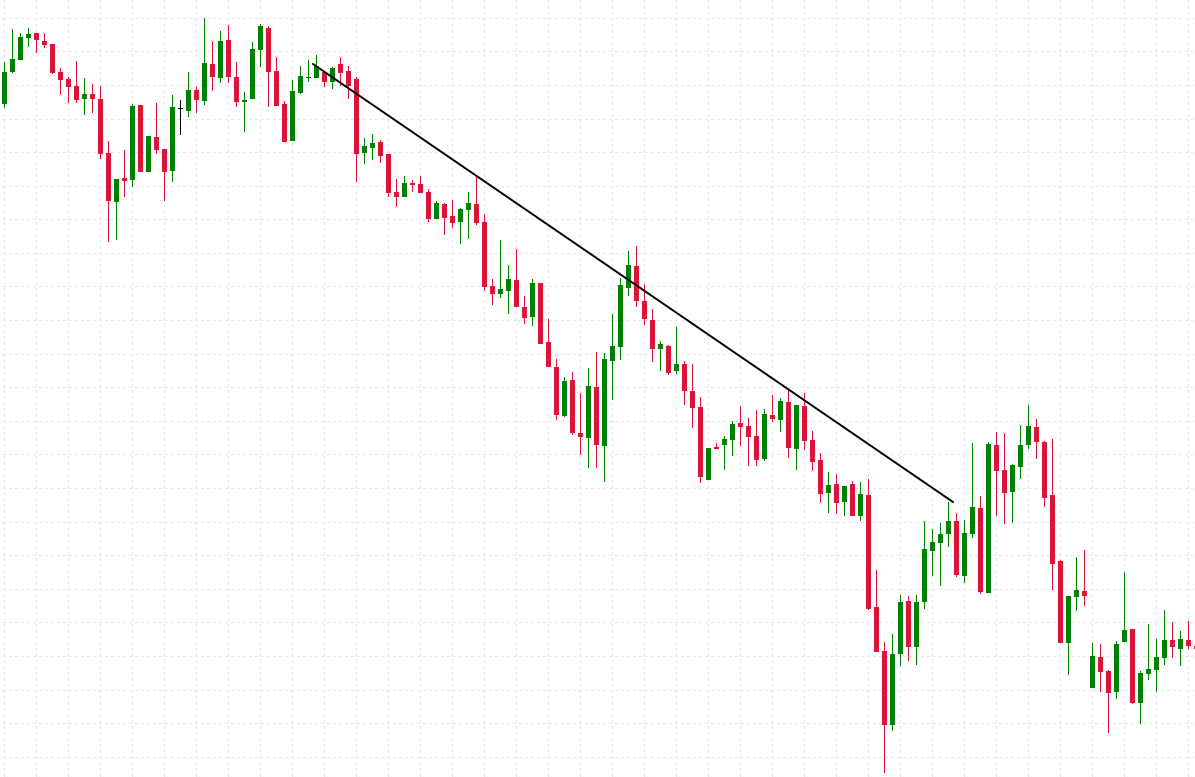
2. Downtrend
The second main type of trend is the downtrend. It is the opposite of the uptrend in that the price is observed to be getting lower and lower as it progresses.
The figure below shows an active downtrend:
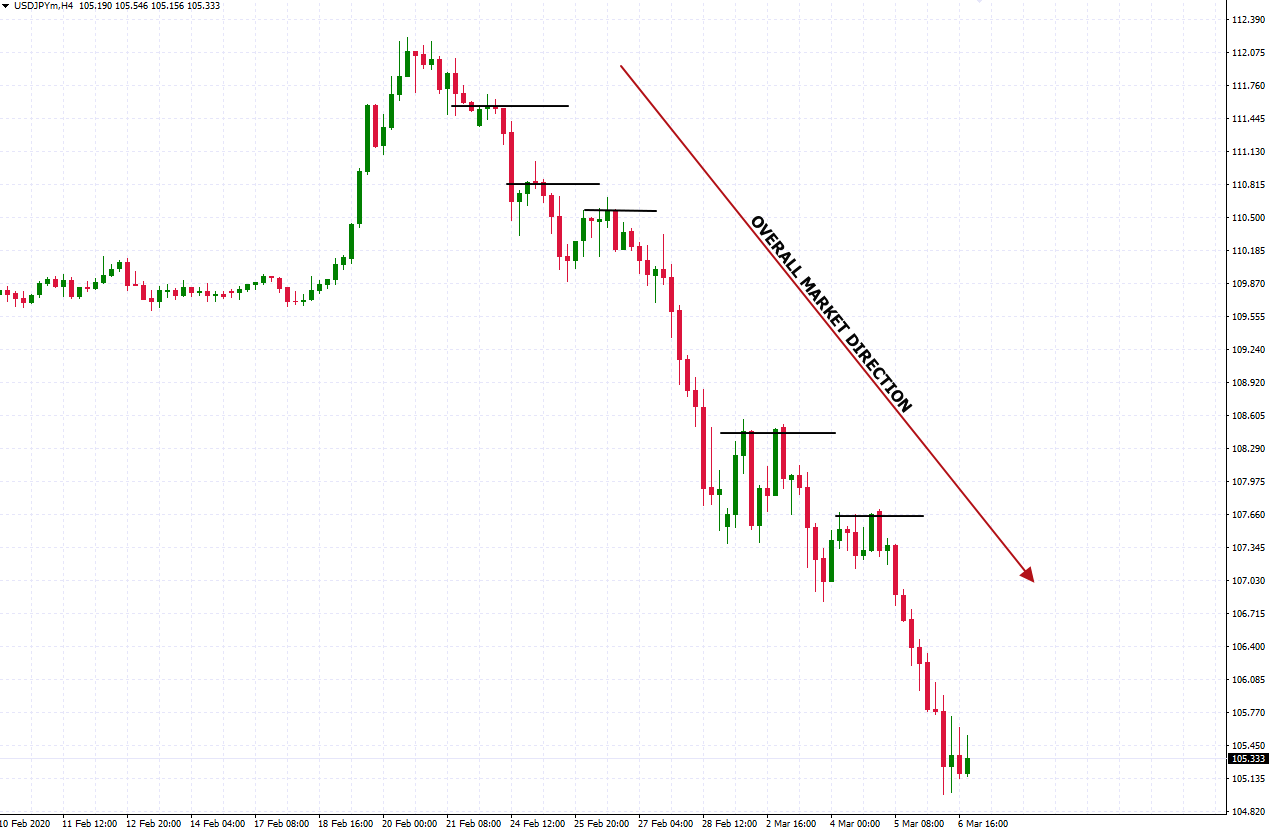
When trading with the trend, we would only be having sell trades in such a scenario.
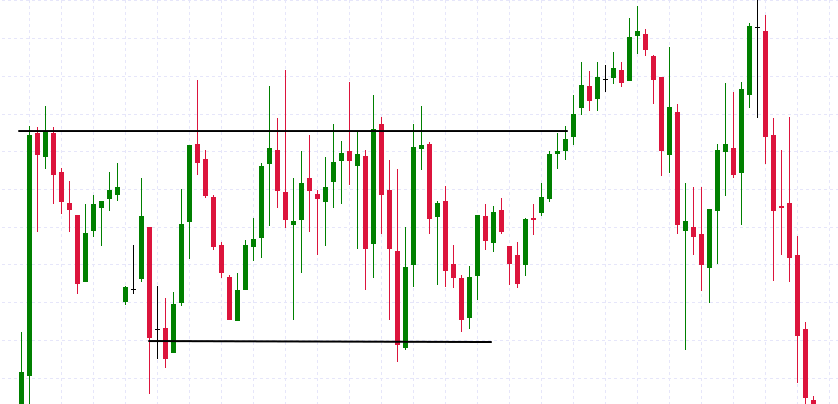
3. Sideways Trend
A sideways market, otherwise known as a ranging market, happens when the price appears unsure of whether to go up or down. It seems to have an imaginary within which it hits the top, reverses to the lower border, then reverses upwards again.
Here is the image of a sideways trend market:
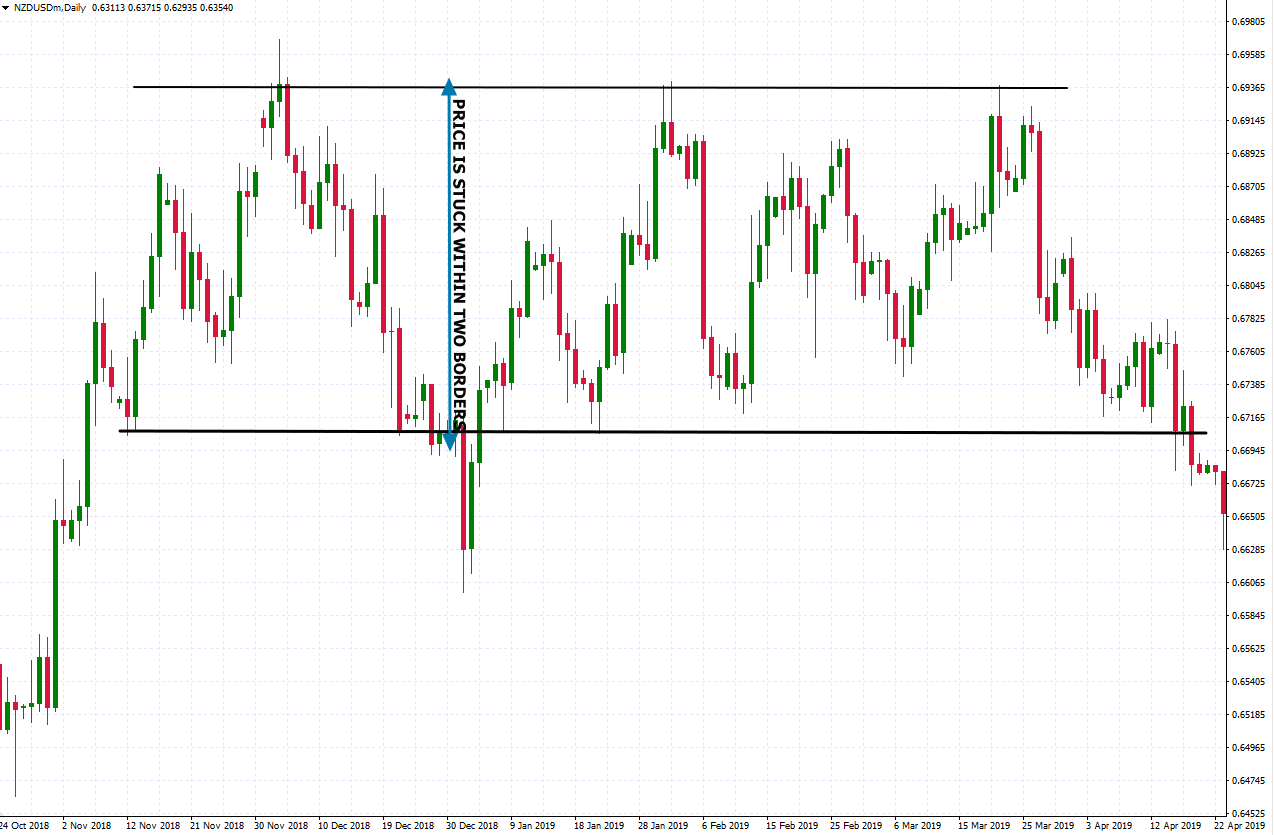
Sideways markets are very tricky to trade in that a trader might think that the price has established a definite direction, only for it to oppose them sharply.
This is why, as a trader, you should know how to correctly identify the dominant market direction before executing a trade.
The problem with most experts who explain trend trading is that they usually end their explanations of trend trading at this. They tell you what an upwards, downwards, or sideways trend is, but don’t bother to explain how to spot one.
Worry not; we got you covered in this next section!
How to Identify a Trend without Indicators?
Trading the market has no definite approach. You can use any method as long as it gives favorable results. In light of this, understand that the list of trend identification methods is infinite since many people have found different and unique ways of doing it.
Therefore, the following methods are only the tip of the iceberg in terms of the many ways of identifying trends.
However, the ones we are about to discuss are amongst the best in that they have been tried and tested, and show favorable results if properly utilized.

Let’s see them now:
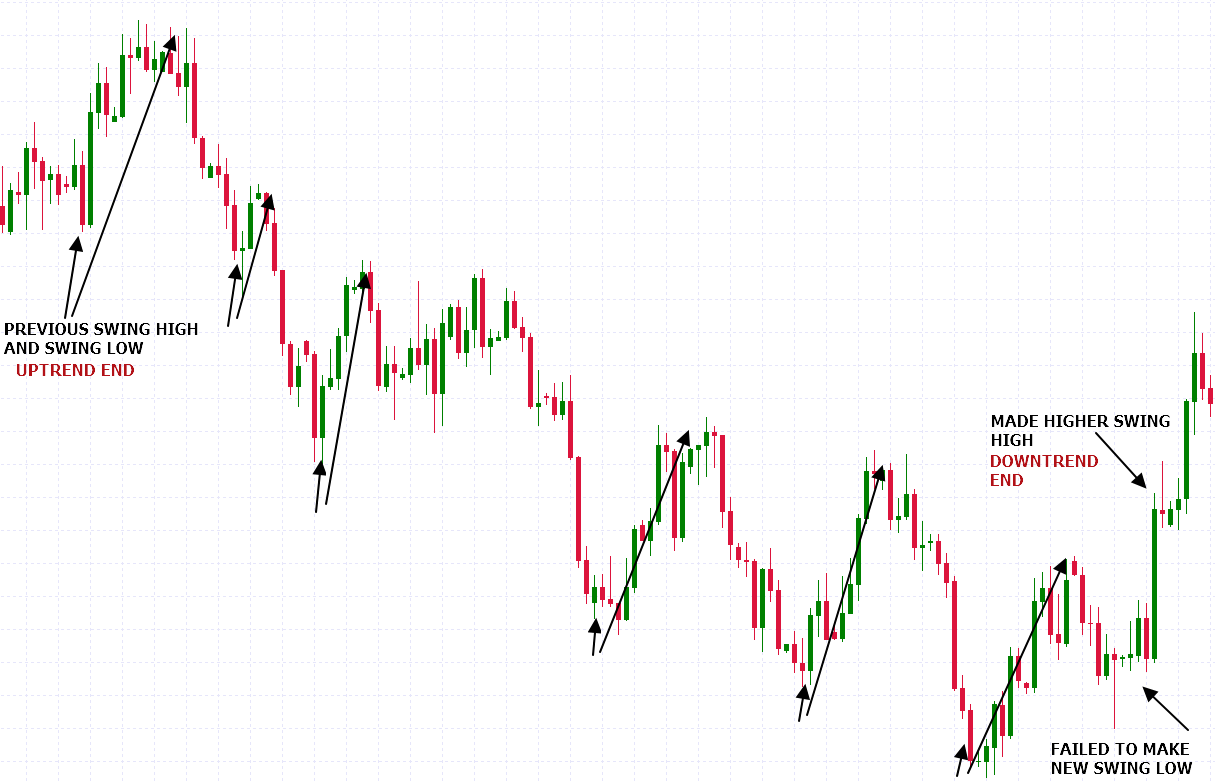
● Market Swings
A market swing refers to an outstanding point in the charts where the price went high or low past previous points. If you look at the three figures that we had above, you will see that the marked points stand out from the rest of the market.
Price behavior is one of the most important ways of identifying trend direction. One of the best trading quotes that I have come across to date states that, “the best indicator is your head.”
What it means is that the best way to read and understand the market is by using your eyes and brain in making judgments. In short, if you understand price behavior, you will have a better understanding of not just trends but the market at large.
That said;
An uptrend can be observed if the market tends to be making higher highs (upper swings) and higher lows (lower swings). Collectively, they indicate that the overall market is going up.
The uptrend will only become invalid or reverse into a downtrend if it stops making consecutive higher highs and higher lows.

On the other hand, a downtrend will be observed if the price is making lower highs (upper swings) and lower lows (lower swings). If this occurrence repeats itself, the overall chart will be observed to be getting lower as time progresses.
The downtrend will end if the price stops making consecutive lower highs and lower lows.
Third, we can see a sideways range if the market seems to be making consecutive upper swings and lower swings in the same area. In short, multiple upper and lower swings will be observed to form in the same area before reversing.
A ranging market becomes invalid when the market breaks past an upper swing or a lower swing.

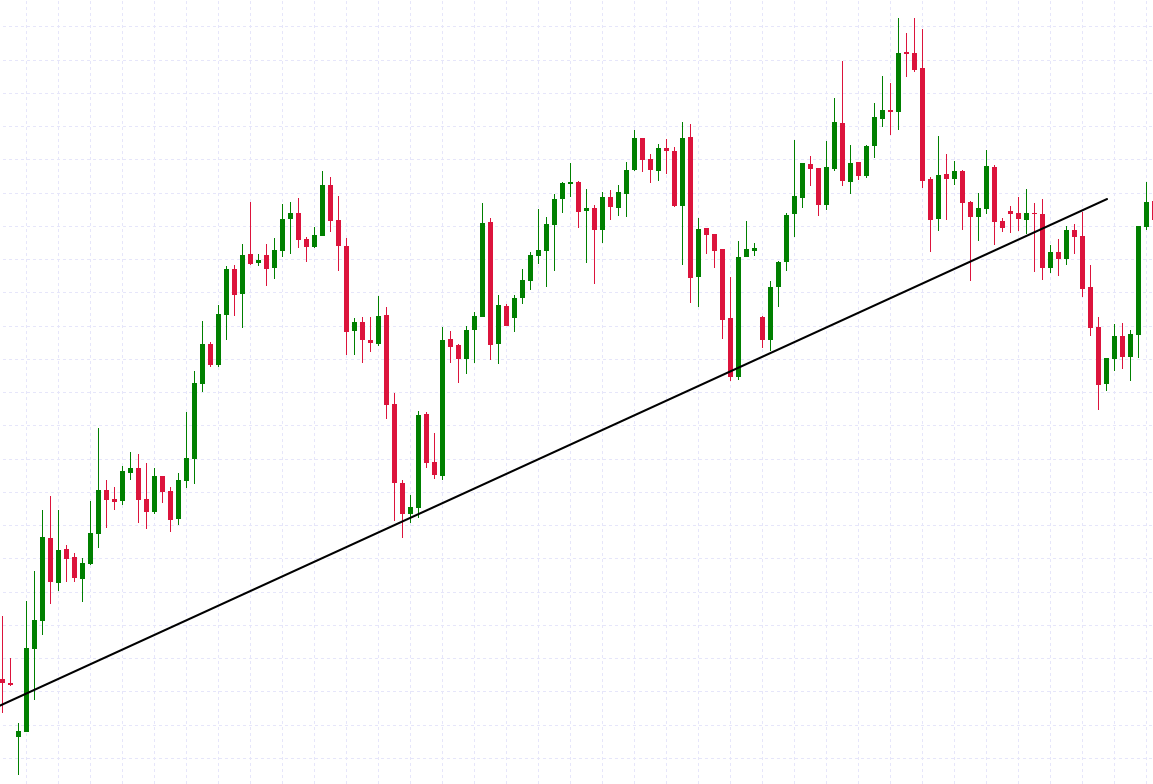
● Trend Lines
A trend line is simply a line that is used to connect several swing highs or swing lows in the market.
If the resulting line slants upwards, then we have an uptrend.
If it slants downwards, then we have a downtrend.
If the trend line is horizontal, then we have a ranging market.
Trend lines are one of the most popular trend identification methods used by traders. Surprisingly, they are also the most underutilized.
Also, a majority of those who use them do not draw them properly. They either use the wrong points or try to force the trend lines to fit their imagination.
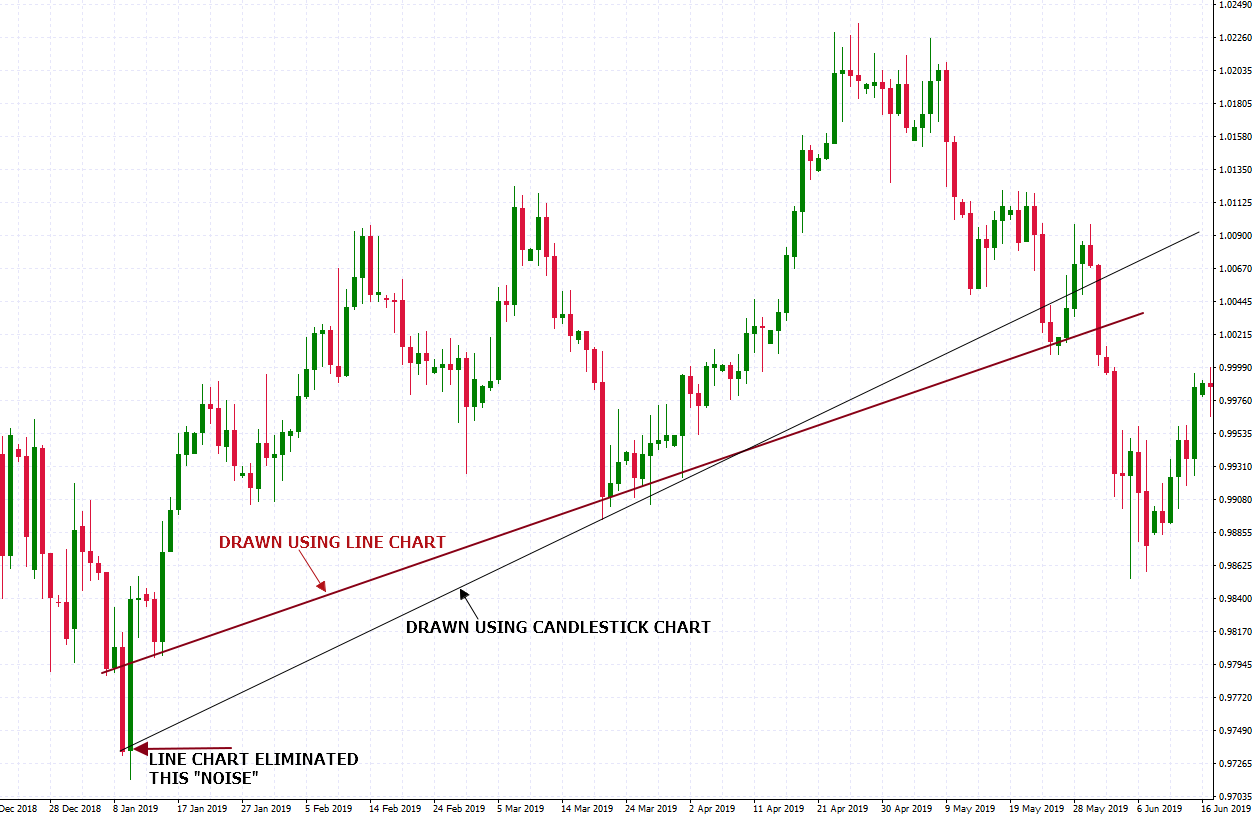
A trick to draw accurate trend lines is to switch from the candlesticks chart to a line chart. After that, draw the trend line on the dominant points. This eliminates the noise created by long candle wicks which usually confuse traders.
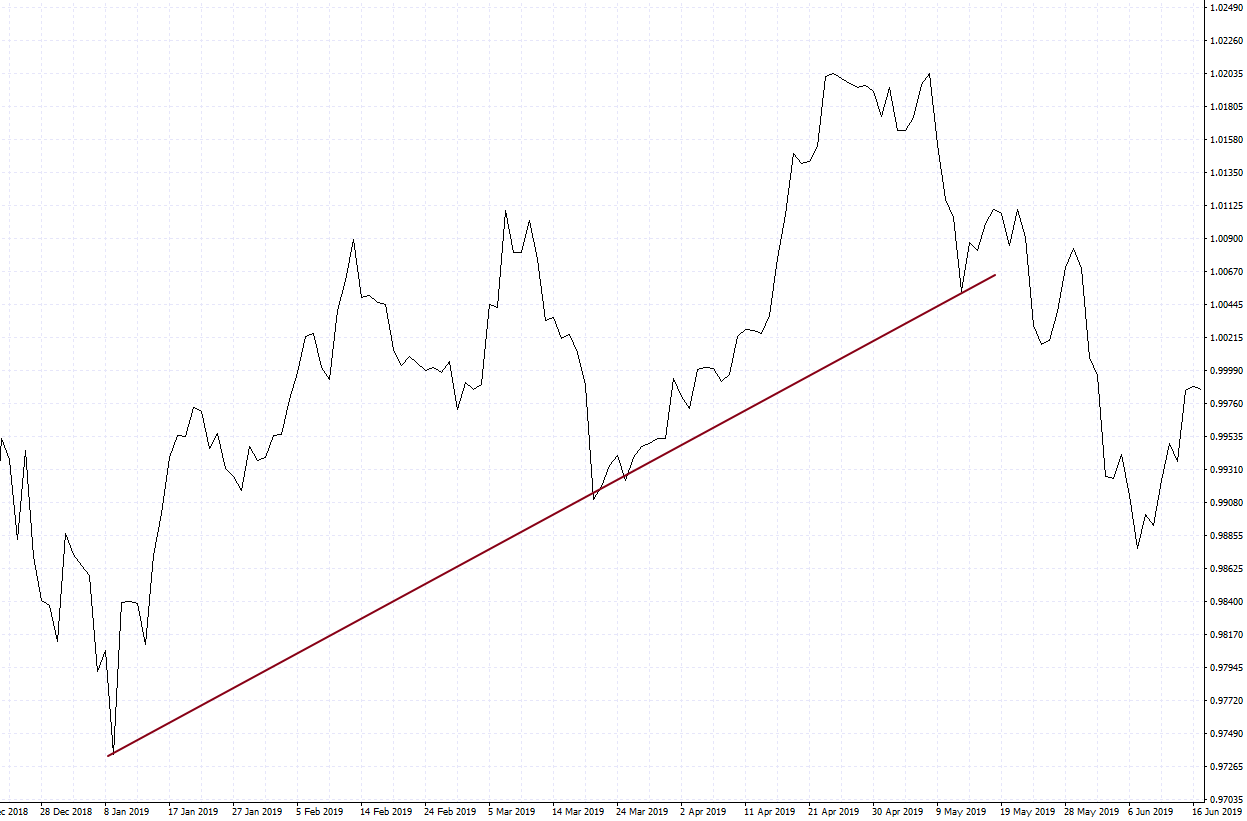
After that, switch back to the candlesticks chart and you will have a perfect trend line to trade with. Below is the same chart with two trend lines; one drawn using the candlestick chart and the other using the line chart.
How to Identify a Trend with Momentum Indicators?
Indicators are controversial tools. You will see some experts warning new traders against their use, while you will meet others that use them all the time.
The thing about indicators is that they should only be guides and not a trader’s master.
In light of these, we are going to look at some momentum indicators that can be very helpful in identifying trends. But first:
What is momentum?
Momentum refers to the intensity [speed] of price change. When we have a high momentum downtrend, it moves faster than when we have lower momentum.
Momentum indicators are very useful in that they can tell when a new trend is about to form or when an existing trend is running out of gas so we can jump out before it is too late. That is why they are known as “leading” indicators since they try to predict the future.
They are also known as “oscillators” since they swing between two points.
We are going to look at two important oscillators and how they can be used in trend trading.
Momentum Indicator 1: Relative Strength Index
The RSI is a simple yet very effective trading tool. It measures the momentum of price by telling when it has been oversold or overbought. The RSI has a line that oscillates between two levels; level 70 represents the overbought threshold. When the price is here, it means the buyers might have sold everything they had, so a downtrend is likely. Level 30 represents an oversold market, meaning the sellers have used up all their resources and an uptrend is imminent. As you can see, it gives an early warning.
Here is the RSI in action:
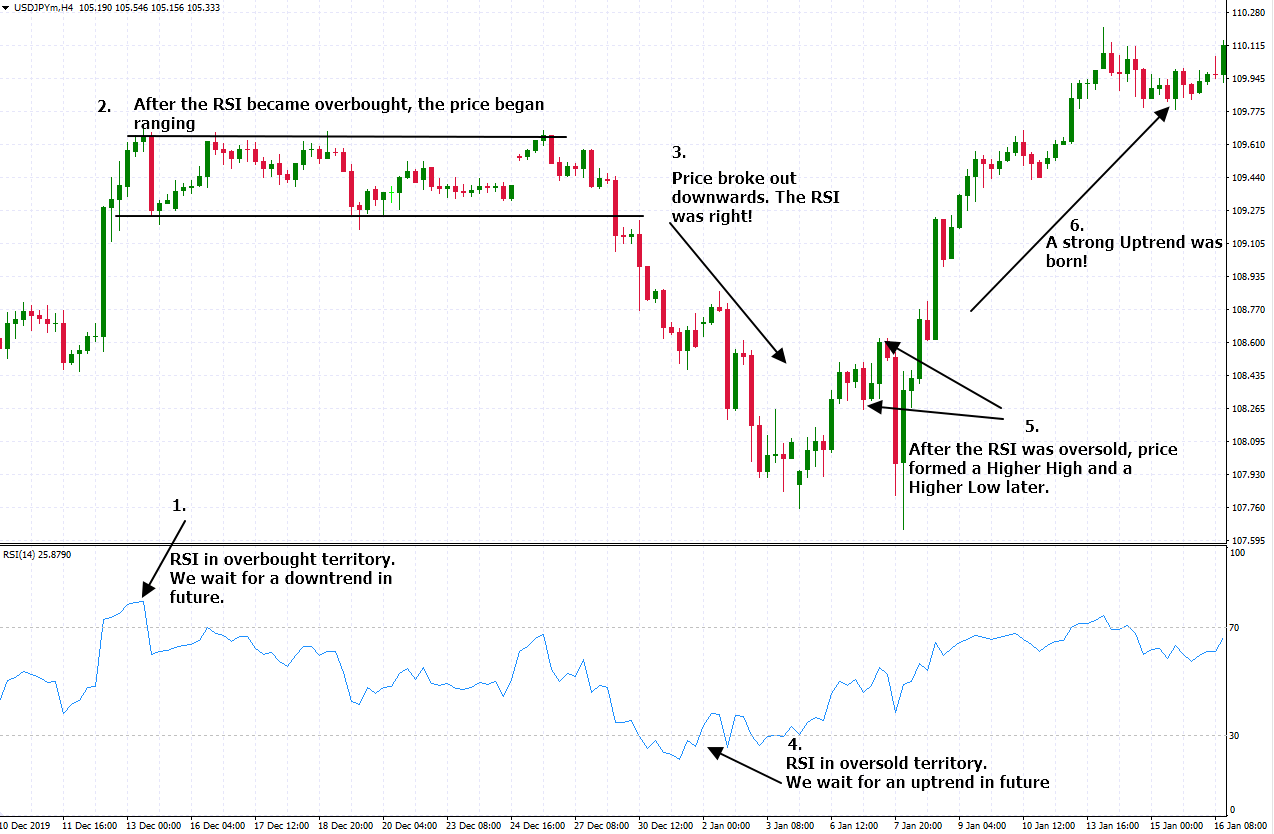
Important: The RSI indicator only tries to predict future trends. At times, it gives false signals, i.e. after it goes into overbought or oversold territory, new trends do not form. Therefore, it should only be used as a warning indicator and never used on its own.
Momentum Indicator 2: Stochastic
The Stochastic oscillator is a cousin to the RSI in that it has an oversold and overbought zone. However, rather than have one line oscillating between the two zones, it has two (blue and red). In addition, the oversold level starts from level 20 while the overbought one starts from 80.
It gives warnings of future trend behavior when the two lines move together into either the oversold or overbought area. The signal is complete when the two lines cross each other.
When in the overbought zone, we wait for the blue line to cross below the red one, and then we have a complete signal. When in the oversold zone, we wait for the blue line to cross above the red line, and then we have a ripe signal to buy.
Once the signals are fully formed, we wait for the trends to change.
Below is the Stochastic indicator in use:
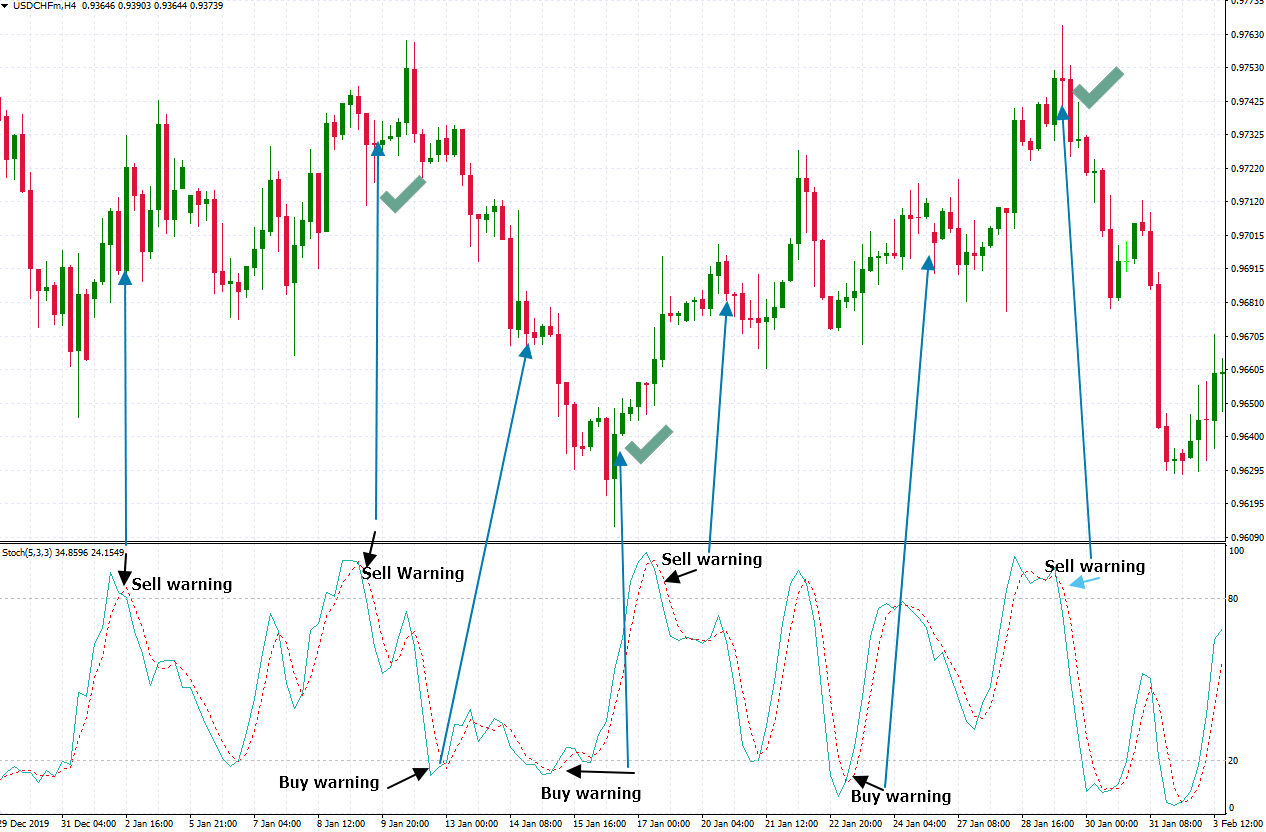
From the figure above, we can see that at times, the Stochastic indicator gave false signals. If we took the trades blindly, we would have made multiple losses.
However, some of the trades were successful.
We can see that, for instance, if the indicator gave a buying alert and then the trader waited for a higher high and high low to form, the trades won. Similarly, after a sell alert, once the price began making lower highs and lower lows, the signal succeeded.
This is why indicators should only advise the trader and not give them trading decisions. From these two momentum indicators, we can see how proper use of indicators can lead to profitable trading.
How to Identify a Trend with Moving Averages?
The final trend identification method is very powerful that it can be used as a standalone strategy.
It uses three Exponential Moving Averages (EMAs).
Moving Averages are popular tools used in trading. They appear as lines on the charts. The lines represent the price that has been smoothed depending on a set value which is a number of days.
For instance, if you have a 13-period EMA, it shows the behavior of price as observed for the last 13 days.
Now, to the strategy:
We are going to use a combination of three EMAs: EMA 200 as our main trend indicator, EMA 50 as our signal indicator, and EMA 21 for entries, re-entries and exits.
A chart with the three EMAs should like the one below:
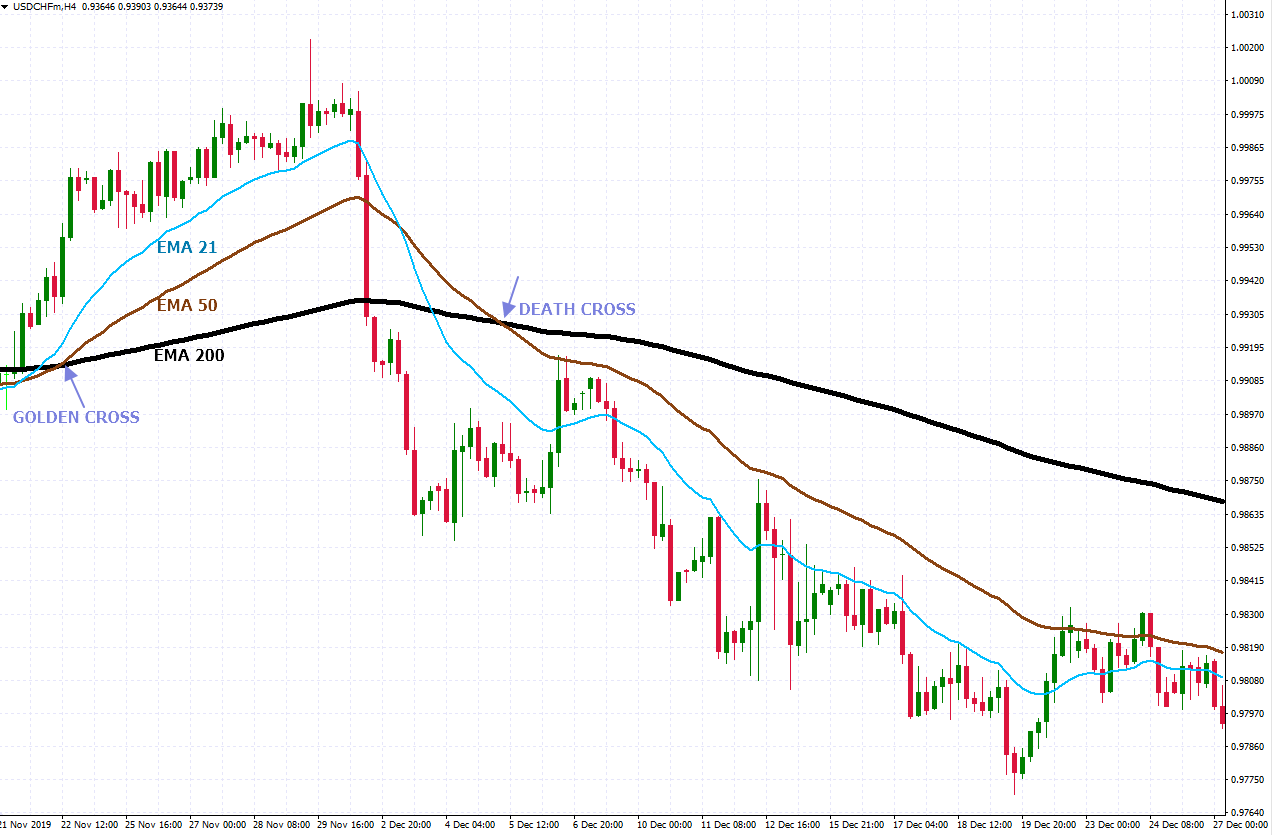
EMA 200
The EMA 200 gives us price behavior as per the last 200 days. Due to this, it takes longer to react to price changes. In this approach, we are going to use it as our trend indicator.
When the market (candlesticks) is above it, the market is said to be in an uptrend during this time, we should only take buy trades. If the market is below it, then we have a downtrend. At this time, only sell trades are advisable.
EMA 50
The EMA 50 will be used to confirm trends. When the market is below the EMA 200 and then the EMA 50 crosses below the EMA 200, that is the confirmation of a downtrend. This cross is called the Death Cross.
If the market is above the EMA 200 and then the EMA 50 crosses above it, then we have an active uptrend. This cross is known as the Golden Cross.
EMA 21
This is the smallest EMA with its 21-day period. It reacts very fast to price, thus, it is used to make trading decisions.
After the death cross, we wait for the price to move and close above this EMA. Then we wait for it to come back and touch or cross it then close below it. If this happens, we open a sell trade at the open of the next candle.
We can add more sell trades to an existing one when price returns to the EMA 21 and touches it then closes below it. It is safe to do this as long as the death cross remains valid.
If we have a golden cross, then we wait for the price to move below the EMA and then cross back up. Once the first candle that crosses back up closes, we open a buy trade.
We can also add more buy trades when the price comes down to the EMA 21 and touches it then closes above it. It is safe to add as many trades as possible as long as the golden cross holds.
The figures below demonstrate the above lessons:
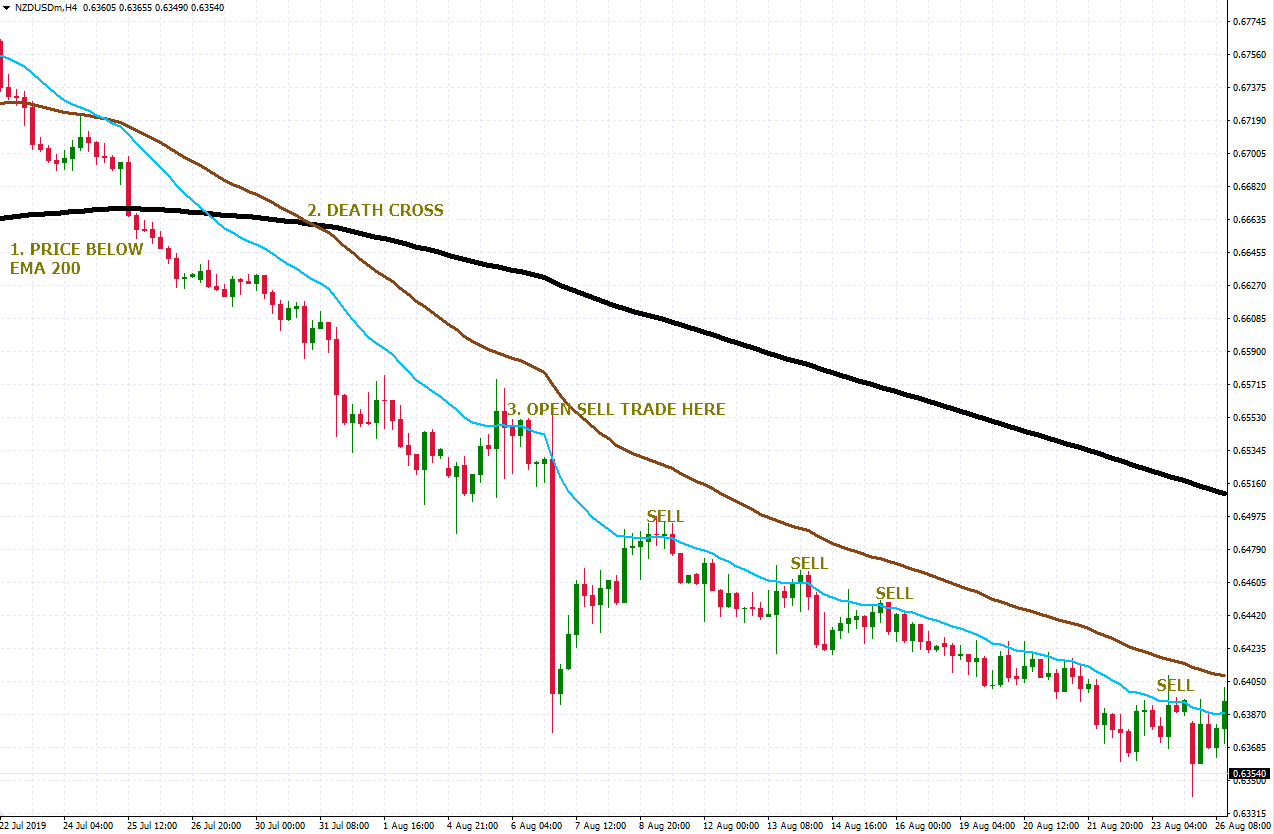
Trading the death cross
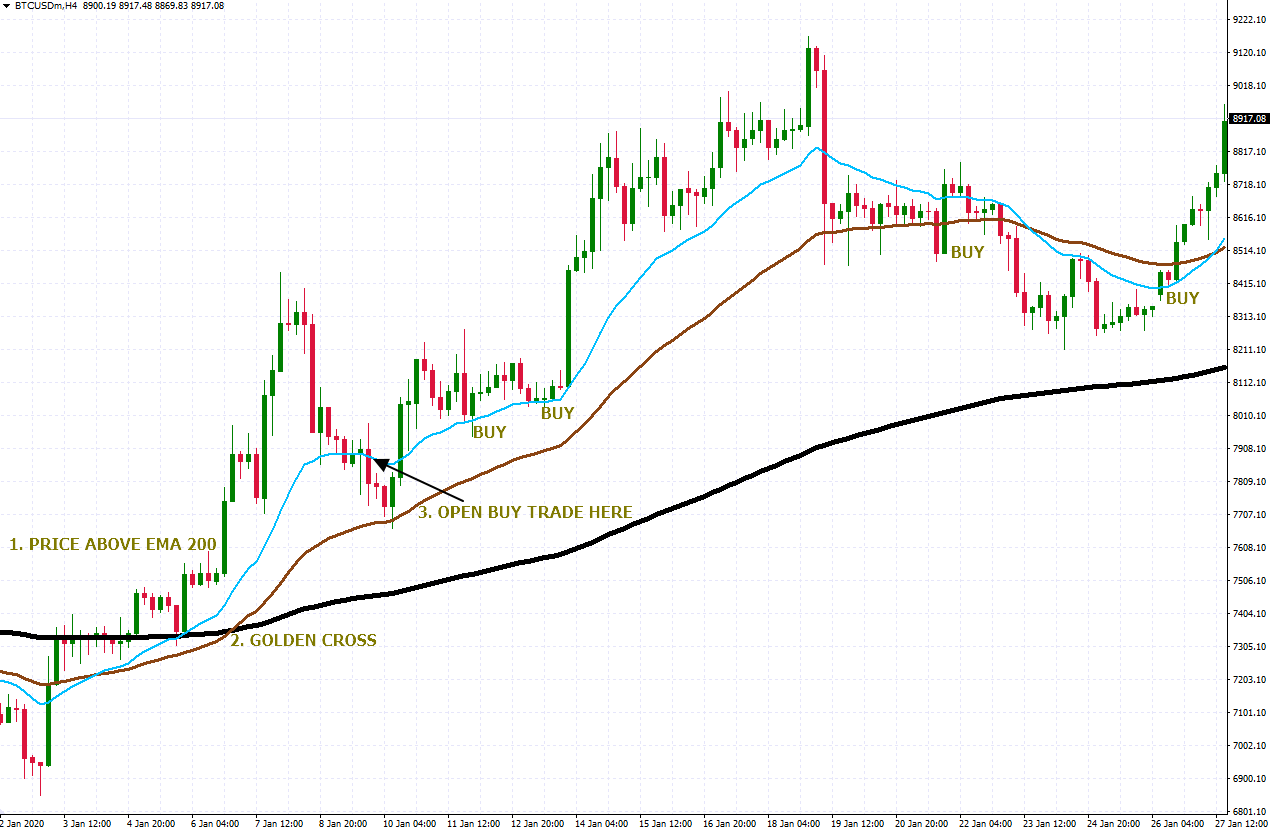
Trading the golden cross
Final Word
That was an enjoyable lesson, wasn’t it?
If you followed through each one of them, then identifying and trading with the trend should now be as easy as biting through butter!
All the approaches discussed in this post work well if properly applied. It is now up to you to put them to the task and see which ones you can adopt for your trading. You can combine two or more if you wish. You could also add these trend-following strategies to your existing trade plan. Remember that trading is yours to explore.
Even as you do, keep in mind that no system is foolproof; there will always be losses. Therefore, even when trend trading, always apply money management such as proper risk, discipline, and using the stop loss. If you observe these, then have no doubt that your trading will go a notch higher.
Cheers to your profitable investing with your trend friend!
Start trading with Mitrade today
Get tight spreads, no hidden fees
At Mitrade, you can invest forex, cryptocurrencies, indices and commodities via CFDs - contracts that track the change in value. Start trading your favorite products all on one app ››
* The content presented above, whether from a third party or not, is considered as general advice only. This article should not be construed as containing investment advice, investment recommendations, an offer of or solicitation for any transactions in financial instruments.

- Original
- Trading Analysis
.jpg)


Risk Warning: Trading may result in the loss of your entire capital. Trading OTC derivatives may not be suitable for everyone. Please consider our legal disclosure documents before using our services and ensure that you understand the risks involved. You do not own or have any interest in the underlying assets.