 Scan to Download
What is Price Action and How It Can Improve Your Trading

Have you ever wanted to trade Forex but didn't know exactly where to start? What if I told you there was a way to trade that was simple, effective, and wasn't time-consuming?
Well, there is, and in this article, I'll explain what is price action trading and how it can help you become a seriously adept trader.
I'll show you a couple of methods that I personally use and have done for years. It's my honest belief that learning to trade Forex (or CFDs) on a bar by bar basis is one of the best ways to achieve your financial goals
Despite all my years in the markets it never ceases to amaze me just how accurate price action can be.
Simply put, price action trading, also known as trading without indicators, is the basis of technical analysis.
So, read on and let me explain what Price Action trading is and how it can make you a systematically better trader. :)
First Step to Master Price Action: Learn Technical Analysis
To explain Price Action, we first need to talk about fundamental and technical analysis.
Most people unfamiliar with the world of trading imagine traders sitting around all day analyzing realms of economic data all in an effort to figure out the market's next move.
Nothing could be further from the truth. Most data released each day has little relevance at all - save for a few short minutes when the news release comes out. Anyway, it’s the job of economists, not traders to make sense of all that.

The analysis of all the news, company reports, GDP stats, etc is known as fundamental analysis and it is for the most part, a long-term forecasting method.
Occasionally one news item does impact hugely but generally, these titbits of news are only small pieces of a grand puzzle known as the financial markets.
A much better way to trade short term is by using technical analysis. This is the study of price charts and from them determine the most likely direction prices will likely go.
One of the principles of technical analysis is the price has already accounted for all the fundamental news.
The other principle is that prices move in trends and that momentum will continue going in one direction until a great force in the other direction stops it.
With the study of price chart patterns, momentum, trendlines, volume, sentiment, and volatility, we get an accurate (ish) idea of where prices are headed in the future and ultimately profit from it.
Different types of Technical Analysis
The subject of charting is a broad one. Many of the original techniques were developed in the late 19th and early 20th centuries and were drawn by hand.
With the emergence of computing, and with the super-fast chip processors we have today, the science (or art) of technical analysis is highly sophisticated. Your personal home computer can run advanced trading software such as the Mitrade trading platform which can perform amazing feats that the old-timer chartists just wouldn't believe.
Listed below are some of the more popular methods used among traders:
● trendlines
● moving averages
● support & resistance
● momentum indicators
● traditional chart patterns
● Dow theory
● Elliot wave
But while all the above do study price, they are not price action.
Price action is a very specific subset of technical analysis.
Price Action vs Japanese Candlesticks
Price action trading, and its counterpart Japanese candlesticks, is a trading method focusing on primarily the Open, High, Low, and Close prices of the most recent trading sessions.
The two are almost identical, but with one originating in the 17th-century rice markets of Japan, the other a western discipline that has gained prominence with the development of computerized markets.
One of the main differences is just the names given to the price patterns. Much of the theory is the same. With candlesticks the names reflect an agricultural feudal society of old Japan, the names of price action patterns are much easier for the modern mind to grasp.
It's important to know a little something about candlestick construction to be a price action trader.
A candle or bar is made up of a high, a low an open, and a close. As can be seen below.

The high to the low is referred to as the range.
The open-to-close (the fat bit of the bar) is known as the real body.
The vertical line above and below the real body is known as the shadow.
Candlesticks can be used on every timeframe from 1 min charts to hourly, daily, weekly and monthly.
After each candle closes, a new one opens and the process begins anew; the candle opens makes a price high, price low, and finally a closing price.
These vertical bars might look like funny drawings to the layperson but to the experienced trader, they convey vital information.
What Makes Price Action Forex Trading Different?
A big difference between price action and other technical analyses is price action traders are concerned with what’s happening at the hard-right edge of the trading screen and only the most recent price data.
This might seem trivial but it’s quite a big deal, especially for short-term trading.
The most recent price action is the freshest price action in the market, these are the levels, patterns, and pivots that the market responds to best
The further away your analysis gets from the present, the less responsive the price levels you are analyzing become.
For example, support or resistance traders connect pivot structures that occurred x number of days, weeks, or months ago.
Starting from the left side of the screen they can right, look for more recent price points, and join them up horizontally. The problem occurs when there are no recent past points to connect the line.
The line is essentially a random line on a chart. And markets don’t respond to random lines, they respond to specific price levels or pivot points.
Unlike support resistance traders who place equal weight on levels from a long time ago, the best price action traders ignore old setups that weren’t triggered soon after they formed.
Forgive my very crude analogy but it’s like continually wearing your old set of clothes as fashions change or they become worn out.
Because price action patterns are the freshest signals in the market they enable pinpoint accuracy that a lot of other techniques just don’t provide.
Why Price Action Trading is Best for Beginners?
Provide the basics of a structured plan
Markets can be complex and are highly competitive. The endless flow of information can confuse if we don' t have a structured trading plan in place. Fortunately, price action strategies can give us the basics of a structured plan.
As retail Forex and CFD traders, we don’t have a bank of economists or analysts at our disposal to interpret fundamental data on our behalf- as financial institutions do. Neither do we have flow, market depth, or client positioning data, used at large trading firms.
Technical analysis is the only edge we possess. It informs us of great entry points in the market in a way fundamental analysis could never do.
By observing simple price action patterns, we put ourselves on level playing field with larger firms who cannot always take the same trades that we do – because of the sheer size of their trading positions.
Retail traders, forex beginners, and stay-at-home traders, all need to use the edges we have to compete in such an environment.
Mechanical Trading Systems
One reason price action trading works so well for less-experienced traders is because it can be used in a mechanical trading system.
What do I mean by this?
There are two broad ways to trade – discretionary and mechanical.
Discretionary trading means that, on the balance of evidence available, a decision is made whether to trade or not.
Mechanical systems are the opposite. There is no decision made, there is no ‘balance of evidence’, just a following of trading rules telling us when to or not to trade.
On the surface, a discretionary system might seem preferable, but it’s not without flaws. For instance:
● have we got all the data the market is concentrating on?
● are we interpreting the data correctly?
● if the trade doesn’t work were we wrong or was it randomness?
These are some of the dilemmas discretionary traders face.
With a mechanical system, none of the above concerns us–we follow a system. We have winners, we have losers but over time the system performs and makes our profits.
Price action trading strategies are perfect with this mechanical approach to the market.
Timeframes and markets for price action
Timeframes are important to traders. Some choose to trade intraday using candlestick bars of 5 mins, 10 mins, 1 hour, or 4-hour charts. Other traders choose a longer approach using 8-hour charts, daily charts, and even weekly charts.
While many traders wish to trade shorter intraday timeframes most technical trading tools just don’t work out well on them. And price action strategies are no different.
There is so much noise on short intraday time that many of the patterns that show up are nothing but random noise.
The optimal timeframe for price action is the daily charts. Really skilled price action trades though could probably go down to 4-hour charts as well.
If you insist on trading on lower timeframes, it’s advisable to combine other trading methods to filter out market noise.
As for markets to trade, one of the greatest things about price action is it responds well to most of them.
Whether you trading stock indices, forex, or commodities the same patterns can be observed on each meaning price action trading is a method that can be used on multiple asset classes.

Basic Price Action Strategy That Actually Work
One of the best ways to enhance understanding is by running through a trade example.
So, I' m going to introduce you to a strategy that is the bread and butter of my trading profits. It’s called an inside bar pattern. It's one of the most widely used price action patterns, though traders will often use it in different ways.
You’ll encounter them often in your trading.
✔️ Consolidations
An inside bar strategy is a volatility breakout strategy. It depicts price consolidation and is potentially a potent setup. On the surface, prices aren’t doing very much, but underneath there is a lot going on.
There’s a subtle battle taking place between the bulls and bears. When the market moves higher a seller comes in pushing it lower. When the market tries to go lower, the bulls step up, pushing it higher again.
It might look like the market is going nowhere, but it's in the process of amassing energy in the same way a ball pushed underwater does.
Eventually, the ball pops ups with force and that’s what can happen after a consolidation too. At some point, the market will tip its hand.
✔️ The Inside Bar
The inside bar pattern is an easy way to depict price consolidation. If you were to change the timeframe on your chart to a much lower one, you’d see the market prices forming a wedge or triangle pattern with lower highs and higher lows.
Traders can place trendlines on either side of the highs or lows and wait for a breakout or they can just wait for an inside bar pattern to form on a higher timeframe.
Look at the image below to see how we would trade this setup.

The first bar known as the mother bar is longer.
The second bar known, the inside bar is shorter. You can see it has a lower high and higher low than the previous candle.
Our task as a trader is to enter the market as soon as the price moves above or below the high or low of the inside bar. In this case, we are going to use a filter (50-day moving average) so we know whether to go long or short.
✔️ Trading Entry Rules
If inside bars closing price > 50-day SMA, then place a buy stop two points (pips) above the high of the inside bar.
If the inside bar closing price < 50-day SMA then place a sell stop two points (pips) below the low of the Inside Bar
If after one day the order hasn’t been executed, then cancel the order.

✔️ Money Management
Knowing when to enter a trade is just one part of a structured trading plan, equally important is being able to protect your capital if it goes wrong!
We do this through a protective stop-loss order.
✔️ Protective Stop-Loss Rules
For the inside bar strategy, we place it as follows:
● the low of the inside bar if placing a buy entry order
● the high of the inside bar if placing a sell (short) order
Proper trading involves knowing when to exit a losing trade, not just about knowing how to get into them. Follow this stop-loss rule and you’ll never go far wrong when trading inside bars.
✔️ Trailing Stop-Loss Rules
We also need to know when to take profits. My preference is to use a trailing stop.
Many traders place trailing stops too close to the current price or too far.
By using the following method, you’ll always get the meat of a profitable trade, but will be able to bail out quickly should the market turn on you:
● when long trail the stop at the low of a completed price bar
● when short trail the stop at the last high of a completed price bar
● keeping move the stop up (down) until the trade is closed out
For short-term trading, the lasting say two to 7 days technique is more than adequate.
How to Use Price Action? For Advanced Traders
The inside bar is but one setup available to price action traders. It’s a simple two-bar pattern suitable for beginners. But if you've grasped it so far let me just push your boundaries slightly with this reversal technique.
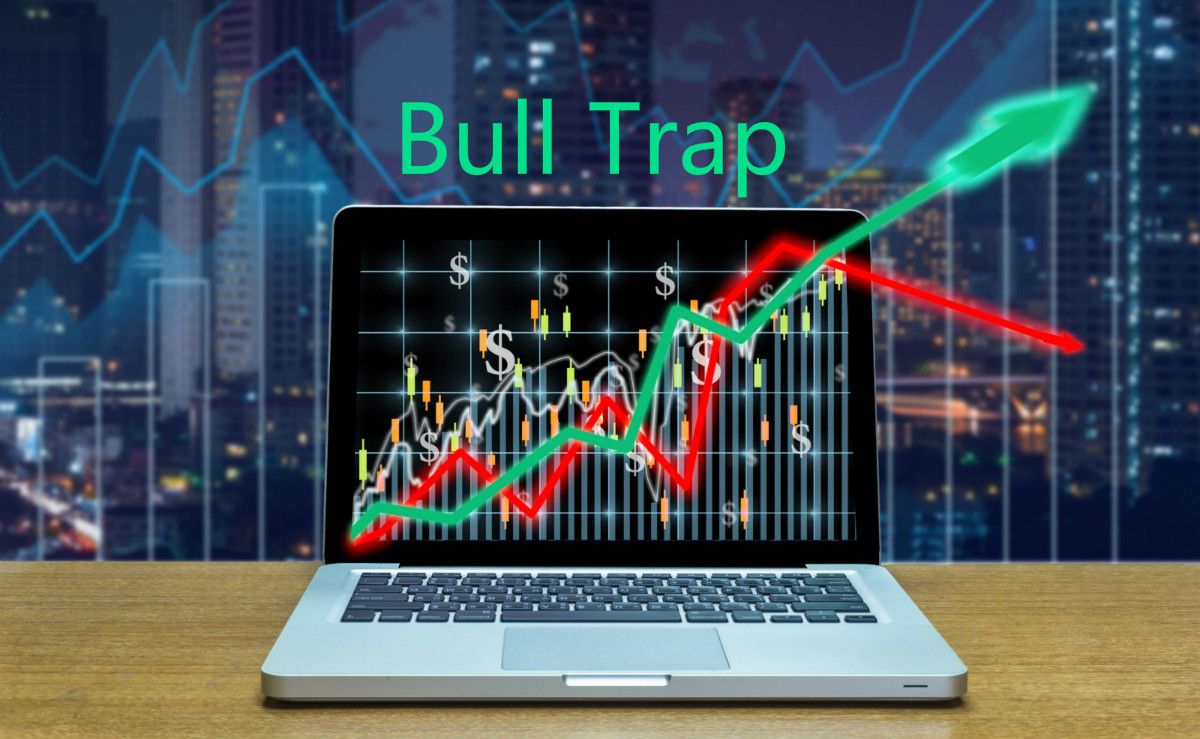
✔️ Reversals
It' s often said the market will try to confuse as many participants as possible, and one way it does this is through price reversals. So what is a reversal?
Well simply put, the market starts moving in one direction, and everybody jumps on board the breakout expecting to make money. Then for whatever reason, it could be news, it could be a resistance level, but the market does a complete u-turn much to the shock of every trader who bought the breakout. It then falls hard and fast.
✔️ The Fakey
One way a reversal is represented in price action trading is through the Fakey. This is a more complex price action pattern one more suited to advanced students of trading.
It's a three-bar pattern and I chose it because it is derived from the previous pattern the inside bar.
Imagine this scenario:
you've followed the inside bar entry trading rules and placed a buy order two points (pips) above the high of an Inside bar.
The order is hit and you' re now in the trade.
The trade works out well and you move into profit quickly – maybe too quickly. Because by the time the New York trading session begins your trade starts to stall, and by the New York close is gone into a full-on decline.
And the end of that first day, you think what the hell just happened?
You’re sitting at the screen thinking how the market could be so damn stupid! You look at the chart and now see this.
The market has just head faked you, and the pattern you now see is a Fakey. And it is a very significant price action setup.
This is how I would trade this strategy.
● Trading Entry Rules (long)
1. there must have been an inside bar pattern two days ago
2. the last day price must break the low of the inside bar
3. the last day price must fall strongly, then rally closing near the high
4. the real body must be engulfed by the real body of the inside bar
5. if the above criteria are all met place a buy stop order two points above the high
6. place a stop loss at the low of the entry bar
7. if the order is not hit after one day then cancel the order
8. if hit, move the stop loss to the low of each new higher bar until stopped out

● Trading Entry Rules (short)
1. there must have been an inside bar two days ago
2. the last day price must break the high of the inside bar
3. the last day price must rise strongly, then fall closing near the low
4. the real body must be engulfed by the real body of the inside bar
5. if the above criteria are all met place a sell stop order two points below the low
6. place a stop loss at the high of the entry bar
7. if the order is not hit after one day then cancel the order
8. if hit, move the stop loss to the high of each new lower bar until stopped out

Price Action Trading with Mitrade
Above are just two of the ways I trade, there are many different systems you could use in price action trading. If you want to know more about this fascinating trading method there are a few great authors who have covered the subject.
Authors such as Al Brooks, Steve Nison, and Martin Pring. Or traders such as Joe Ross, Larry Williams and Linda Raschke.
With an account at Mitrade, you get to use a state-of-the-art trading platform on both desktop and mobile. This is important when making your buy and sell trading decisions
Whether you choose to set up your price action trading station with Japanese candlesticks or prefer traditional HLC bars the platform allows you to trade stock indices, currencies, cryptos, and commodities - all of which work favorably with price action.
If you want to practice the price action strategies I’ve discussed, at Mitrade you can set up a free demo account.
Happy Trading!
* The content presented above, whether from a third party or not, is considered as general advice only. This article should not be construed as containing investment advice, investment recommendations, an offer of or solicitation for any transactions in financial instruments.

- Original
- Trading Analysis
.jpg)


Risk Warning: Trading may result in the loss of your entire capital. Trading OTC derivatives may not be suitable for everyone. Please consider our legal disclosure documents before using our services and ensure that you understand the risks involved. You do not own or have any interest in the underlying assets.