 Scan to Download
Top 20 Chart Patterns Seasoned Forex Traders Use To Boost Results|Cheat Sheet

The forex market price movement forms patterns naturally. These patterns take different forms, ranging from objects to shapes like triangles. They are known as chart patterns. Besides the chart patterns, price action also creates animal-like patterns like crab or butterfly, known as harmonic patterns. But that is a topic for another day.
What is the importance of chart patterns? This is a question many traders ask.
Here is a straightforward answer. Patterns in a chart are integral parts of technical analysis, especially for price action traders.
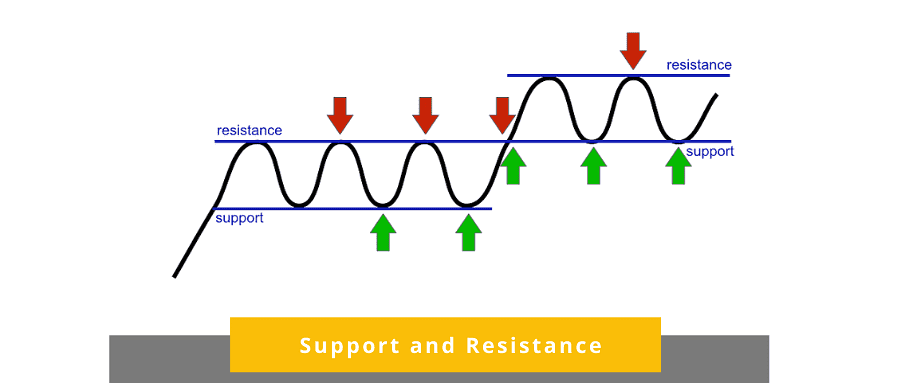
Identifying the patterns helps you predict the likely price direction. For instance, the triple top chart pattern is a tell-tale sign that the market is about to reverse from an uptrend to a downtrend. Essentially, the pattern in a chart tells you whether the market is poised for reversal or continuation. They tend to be more useful when they form at the resistance or support levels.

These articles explore the top chart patterns that any aspiring forex trader should know. But before that, we shall look at three categories of chart patterns.
Continue reading.
Chart Patterns Categories
Chart patterns can be grouped into three broad categories.
1. Continuations - Continuation patterns indicate that the market is resting, and the trend will resume its original directions
2. Reversals - signal that the market will change direction. If it forms during a bullish trend, you should consider going short. Contrastingly, if the pattern forms during a downtrend, the plausible decision is to open buy positions.
3. Neutral patterns - These are bilateral charts signaling that the price can head, either way. In other words, the price can reverse or continue with the initial direction.
Practice your trading skills with a demo account!
Reversal Chart Patterns Cheat Sheet
1. Head and Shoulder

This is one of the most popular and reliable chart patterns. It forms after an uptrend, a clear indication of a topping reversal. To give you a clear picture, the structure of the patterns takes after the human anatomy, with a head and two shoulders above a neckline.
The pattern forms when the prices go high and corrects to create a support level known as neckline. The price then resumes the uptrend hitting a higher peak. The price corrects but moves upward for the third time. However, the push is not strong enough to match the second top and is typically equal to the first high. After the third peak corrects, the price breaks below the neckline into a strong downtrend. Ideally, you should enter when the price breaks below the neckline. The reversals strength is proportional to the momentum before the pattern.
Want to know how to use the Head and Shoulders Pattern to identify trade entry points? Click to read this article.
2. Inverse Head and Shoulder

The inverse head and shoulder is the complete opposite of the head and shoulder pattern. After completion, it signifies the downtrend is coming to an end, and the bulls are ready to take control of the market.
The pattern makes three successive lows, with the middle one (head) being the deepest. The other lows form shoulders and have equal length. The third trough might make a higher low than the first and second troughs, illustrating a dwindling momentum. It also tends to have less volume. The momentum increases after the price breach the neckline, with the reversal matching the preceding downtrend strength.
3. Triple Top

The triple top chart pattern forms after an uptrend and signals an impending trend reversal. Ideally, the market finds resistance and trackbacks falling into minor support, which becomes the neckline. A rally pushes the price to the resistance point and pulls back again to the support line. Again, buyers push the price higher one more time and find rejection at the resistance, forming three equal tops. The three tops signify a massive resistance. The pattern is confirmed when a candle closes below the neckline.
4. Triple Bottom

The triple bottom is the complete opposite of the triple top. It touches a support level three times. The pattern starts with a downtrend which faces a rejection followed by a small pullback. Selling pressure resumes and pushes the price down. Again, the sellers are rejected at the previous support level. The price retraces a second time but suffers the same fate. After testing the support level unsuccessfully, the sellers give up. The price rallies and breaks above the neckline. The close of a candle above the neckline confirms the buying signal.
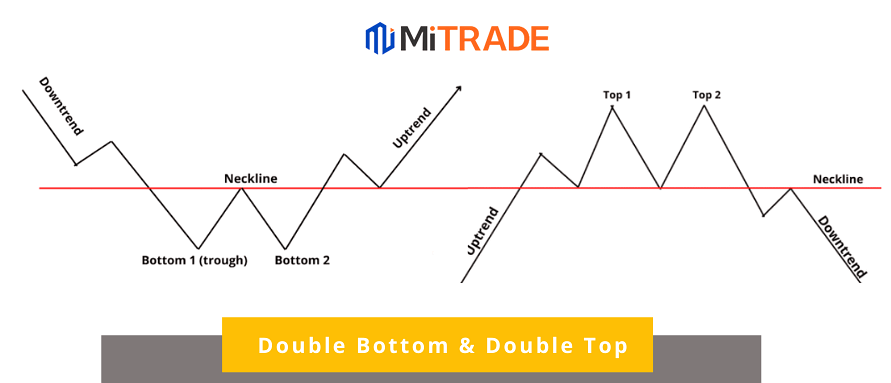
5. Double Top

As the name implies, double top forms after the market hits a resistance level twice. The price retraces after reaching a certain level and comes back to retest it. A strong downtrend follows when the price fails to break above the resistance and breaks below the neckline. The result is two peaks at the same level forming an M-like structure.
The minor support that forms before the rally is called the neckline. The pattern is confirmed after breaching the neckline. It indicates the uptrend has ended, and traders should look for sell trades. A better approach is to wait for the price to breakout from the neckline and return to retest the neckline. This indicates a strong bearish signal.
Read more: Spot An Ideal Double Bottom & Double Top Pattern and Start Trading
6. Double Bottom

Double bottom is a buying signal that forms after a downtrend. The price holds two bottoms but fails to break lower, creating a W-like form. It illustrates that selling momentum is diminished.
The pattern is characterized by a distinct price drop followed by a slight pullback. However, the rally lacks enough momentum and goes back to the support level. A bounce follows, completing the pattern. A buy signal is confirmed when a candle closes above the neckline.
Like in a double top, you will want to wait for the trend to retest the neckline. Usually, the double bottom forms a strong support zone preceding a strong change in trend direction. It signifies that the price has failed to go lower, and you should get ready for an uptrend.
7. Cup and handle

We believe you have used a cup before. In the likely event that you have not, you have probably seen a picture of one, right? Well, the cup and handle chart pattern, as the name implies, looks like a cup. How does the chart form?
Ideally, a consolidation phase characterized by a price drop followed by a small rally equal to the decline creates a U shape - the cup. After hitting the top of the cup, the price drifts sideways or downwards to form a handle. A triangle pattern can also be a handle. The pattern is invalidated when the handle drops below half of the cap. Ideally, it should not fall below a third of the cup. Avoid using cup and handle patterns that have v shape. A subsequent breakout confirms the bullish signal.
8. Rounding Bottom and rounding Top
Rounded chart patterns have a semi-circular shape. The Rounding top is characterized by a strong uptrend and a consolidation phase. The upward rally dwindles, leading to a consolidation phase that forms around top. In some cases, the rounded top pattern is similar to the head and shoulder pattern. In this case, the neckline is the level where the strong uptrend stops and enters into a consolidation phase. The sell signal is confirmed when the price falls below the neckline. The rounding top is also referred to as a sauce.


The rounding bottom is akin to the rounding top but forms at the end of a downtrend. The buy signal is confirmed when the price breaks above the trendline.
Continuation Chart Patterns Cheat Sheet
Continuation chart patterns form after a strong downtrend or uptrend. They are a tell-tale sign that the original trend will resume. This pattern in a chart is characterized by a ranging or consolidation phase. In other words, continuation. Traders should get ready to open or add sell positions if they appear during a downtrend.
In simple terms, continuation patterns signify the market is resting before resuming the original trend.
1. Pennant Patterns

Pennants are continuation chart patterns that appear after a strong trend. They can be either bullish or bearish, depending on the direction of the price movement. Pennants can be confused with the triangle pattern. However, they feature a flagpole, a distinct feature from other patterns. Put differently, pennants are l preceded by a strong trend that forms the flagpole. The markets consolidate after the flagpole forming the pennant.
How do you trade a pennant pattern? Bullish pennants give a buy signal when the price breaks out upwards (above the pennant). Traders should expect a renewed bullish momentum. Similarly, a breakout below the bearish pennant to resume the initial downtrend completes the patterns. During a strong uptrend, some buyers exit the market, but sellers are not enough to push the price down, leading to the accumulation phase. The trend resumes taking the price even higher.
2. Flag pattern

The flag pattern is yet another neutral chart pattern. It signifies the market is pausing before resuming its original trend. The flag pattern can be either bearish or bullish. The bullish flag pattern forms during uptrends giving traders a chance to ride the trend. Similarly, the bearish flag offers traders an opportunity to jump into a downtrend.
How does the flag pattern form? A strong trend precedes the flag chart pattern. Some traders exit the market leading to a consolidation phase. The price moves within a rectangular channel, which slant slightly upwards for the bearish flag and slopes downwards for the bullish flag. Traders should look to enter after the price breaks outside the flag pattern.
3. Ascending and Descending Triangle Chart Patterns

Triangle chart patterns are continuation patterns that occur frequently. Ascending and descending triangles patterns are formed when price moves in a tight range in sideways directions. Connecting lows and highs with trendlines form a triangle shape. The swing lows and swings highs should touch the trendline at least two times. Triangles give a trade entry signal when the price breaks out in the direction of the previous trend.
Ascending triangle forms when the upper trendline is flat while the lower trendline slopes upwards. The upper trendline marks a price level that buyers have failed to surpass. However, they are more aggressive than sellers and push prices higher, forming higher lows. As the pressure builds up around the resistance level, the price is bound to break upwards.
The descending triangles are the complete opposite. Sellers fail to break below a support level. However, there is increasing selling pressure forming lower highs. The sellers eventually take control of the market, breaking below the triangle. An ideal trading strategy involves entering the trade when the price breaks below the trendline and placing a stop-loss above the triangle.
4. Symmetrical Triangle

The symmetrical triangle is yet another triangle chart pattern. It is from when the price's lows and highs slope and converge to form a triangle. The buyers and sellers exert equal pressure in the market, but neither are pushing the price in their direction strong enough to establish a clear trend. The triangle is formed by connecting two high and two lows.
Unlike other triangle patterns, the symmetrical triangle is a neutral pattern meaning it does learn towards any trend. In other words, the price could go either direction. But it tends to favor the existing trend.
5. Rectangle Pattern

The rectangle chart pattern appears when the price consolidates after a strong trend. The price moves sideways in a tight range bound by parallel support and resistance lines. When the highs and lows are connected, they form a rectangle. The strength between the buyers and sellers is equal, neither throws a strong punch to beat the other side to the ground. Once the price breaks out, it extends an equal or higher length than the size of the rectangle channel. A rectangle pattern in a chart is also referred to as a consolidation zone, range, or congestion area.
A rectangle formation during an uptrend is referred to as a bullish rectangle, while the bearish rectangle forms in a downtrend. Here is a pro trading tip. Wait for the price to break out of the box and come back to rest the rectangle. To put it into perspective, the resistance line of the bullish rectangle becomes the support. Similarly, the support line of the bearish rectangle becomes the resistance.
6. Wedges
The rising wedge is one of the most interesting chart patterns. They form within a range that narrows over time. It gives trading signals depending on where it forms in the market. In other words, there are reversal and continuation wedge patterns. Let's explore the two types of wedge chart patterns to understand how to profitably use the wedge chart pattern.
Falling Wedge

When a falling edge forms during an uptrend, it signals market continuations. However, the falling wedge features lower lows and lower highs. A falling edge after a bearish trend is a telltale sign of an impending trend reversal. The lower high forms at a faster rate than the lower low. Therefore the line connecting the resistance (highs) is steeper than the support line ( lows).
Rising Wedge

The rising wedge is the complete opposite of the falling wedge. When it forms a downtrend, it is a continuation pattern. However, it indicates a trend reversal when it forms in an uptrend. The pattern is characterized by higher lows and higher highs that converge in a tight range. It slopes upwards as the new higher lows form faster than the new highs.
7. Price Channel

The price channel, also known as a channel pattern, is a continuation pattern. The channel can be either bullish, bearish, or horizontal channel pattern. It is formed when the price moves within two parallel lines. The channel is formed by connecting the series of highs and lows using trend lines. Bearish channels slope downwards while the bullish channels slant upwards.
When the bullish channel forms in an uptrend, it indicates a continuation of the initial bullish trend. However, the signal fails if the price breaks below the channel line. Traders should look to exit the long positions.
The bearish channel signals a continuation channel when it forms during a downtrend. If it breaks above the main trendline above the channels line, the signal fails, and the price reverses.
Besides trading continuation, some traders choose to trade within the channel buying when the price hits the support line and sell at the resistance line.
8. Expanding Triangle

The expanding triangle is a neutral signal, albeit rare. It forms when the breakout traders get trapped by stop-loss triggers. The bulls are trapped when the price hits highs and bears when the lows are hit. The price retraces back into the pattern. This is one tricky pattern to trade. The whole idea is to wait for the price to break out of the triangle lines. A reversal is confirmed when the price fails to enter the channel again.
Practice Trading with Mitrade
Here is how you go about opening a demo account:
Step1: Register ——To use mitrade, you need to sign up here. You can opt to use an email address or mobile number to sign up and set the password.
Step2: Choose Account——Once you log in, you will see a menu at the upper right corner that allows you to choose between a demo or a real account. Select the demo account if you want to practice. Similarly, you can opt for a real account if you want to start trading immediately.

Step3: Choose trading pairs——Mitrade comes endowed with an array of trading assets. It gives you access to over 300 commodities, stocks, CFDs, indices, cryptocurrencies, and forex.

Step4: Choose price charts and indicators to analyze——Choose the candles to take advantage of candlestick patterns. There are 7 types of price charts to allow you to choose a graphic that appeals most to your trading plan. Mitrade also offers hundreds of indicators to refine your technical analysis.

Step5: Open short or long positions——Simply click on the red “sell “ button to enter the sell trade. If you believe the instrument value will go up, press the "green button” to open a buy position.

Practice your trading skills with a demo account!
Final Words
Trading profitably in the markets requires a proper understanding of market behavior and taking the necessary action. For instance, if the market is signaling a reversal, you should look to close the running trades and perhaps open new orders.
One way to determine whether the price will reverse or continue is by using the chart patterns. Some signify the market will reverse, while others indicate an impending trend continuation. Therefore, it is prudent to understand the different chart patterns and how to use them optimally.
We have done a hard job putting these chart patterns in this guide. Now take your time, go through the patterns and start using them to trade accordingly on the Mitrade platform. You will be glad you did!

Practice your trading skills with a demo account!
* The content presented above, whether from a third party or not, is considered as general advice only. This article should not be construed as containing investment advice, investment recommendations, an offer of or solicitation for any transactions in financial instruments.

- Original
- Trading Analysis

.png)


Risk Warning: Trading may result in the loss of your entire capital. Trading OTC derivatives may not be suitable for everyone. Please consider our legal disclosure documents before using our services and ensure that you understand the risks involved. You do not own or have any interest in the underlying assets.