 Scan to Download
Spot An Ideal Double Bottom & Double Top Pattern and Start Trading (Beginner's Guide)
After an extended uptrend, the markets tend to reverse. But how do you know when the market is poised for a reversal?
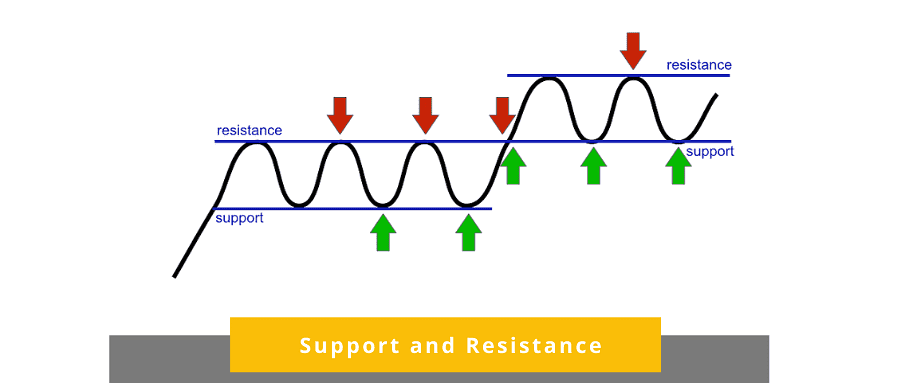
One of the ways is waiting for the price to reach a resistance and support level. But sometimes, the trend hits these zones and gives a false reverse signal before resuming the initial.
In this case, the markets seem to reverse, but immediately the bears open short positions, it rallies again. Once stopped out, the market now reverses with revitalized vigor. This leaves many traders confused.
Download Mitrade forex app to practice your trading skills!
Learn More Open Account Windows/ App IOS/ Android
Enter the Double Top and Double Bottom Chart Patterns
The confusion makes traders reluctant to open a trade. In the process of waiting, an uptrend turns into a downtrend and moves hundred of pips, and they miss a trade that would have otherwise raked in good profits.
This is where the double top and double bottom chart patterns come in handy.

Double Top
Double top and double bottom are reversal chart patterns on trading charts. The double bottom is a bullish reversal pattern, while the double top is a bearish reversal pattern.

Double bottom
Double tops form after an uptrend and are characterized by two peaks typically of equal heights and a trough in between. It is a telltale sign that the uptrend is coming to an end, and you should get ready to short the currency pair or instruments.
The peaks mark an unbreakable level that the market is unlikely to surpass. Once the market hits this level, it pulls back and returns to retest the level. The double top formation is complete when the price bounces from that level again. The entry order should be right below the neckline with anticipations of market reversal.
Double bottom forms after a downtrend and consists of two troughs separated by a peak-in. It signifies that supply has outweighed demand twice in a short time. When the second trough fails to break below the first one, It indicates dwindling selling pressure and signals that bulls are ready to take control of the market. It is unlikely that the price will break below this level. You should look to open buy trades.
Essentially, double top and double bottom are mirror copies of each other. While the double top resembles an M letter, the double bottom looks like a W shape. The patterns usually come after several rounding tops and bottoms.
The two chart formations are reversals signals. This means that you should get ready to open positions in the opposite direction when they appear in price action.
Here is a secret. The price reversal after breaking the neckline is typically equal to the double top formation. This means it will cover the same number of pips as the ones between the neckline and peak of the formation. This information will help you when setting the profit targets.
How to Spot an Ideal Double Top and Double Bottom Formation
Not all double top and double bottom formations give good trading signals. Some fail because trades don't take time to find suitable patterns. An excellent double bottom chart pattern should consist of the following elements.
1. Prior Downtrend
An established trend precedes reversal patterns, and the double bottom is no different. A prior downtrend should be clear.
2. First Trough
The price bounces off after hitting a support level, creating the first trough. The new lower low should be the lowest part of the existing trend. It forms a swing low.
3. An in-Peak
After hitting the support level, a rally moves for a considerable period, typically 10% or 20% of the trend, forming a peak. In some cases, the volume increases, signifying accumulation. Also, the peak might be rounded due to traders' hesitation as bulls and bears square it out to push the price in their direction. While the buying pressure is not enough to push the price higher, the buying pressure is increasing.
4. Second Trough
As mentioned, when buyers fail to push the prices higher. The instrument's value drops and finds support at the support level of the first trough, but a 3% difference is allowed. The decline is characterized by minimal volume, indicating there is not enough selling pressure either. The period between the two troughs might vary, ranging from several days to months depending on the time frame. The trough completes the pattern when the price rises from the swing low to the neckline.
5. Neckline
The neckline is where all the action is. Once the price touches this line, you should now get ready to jump into the trade. But not so fast! This is one of the mistakes the newbie traders make, and before they know it, they are counting losses and blaming the market. The pattern is prone to false breakouts.
So what do you do? The answer is simple. Simply wait for the market to retest the resistance turned support.
Here is an illustration. Wait for the price to break above the neckline, pull back and find support at the neckline. If it bounces off the neckline, open a long position and ride the trend.

Rules for Trading of the Double Top and Double Bottom Chart Patterns
First, identify the market trend. A double top should appear after an established uptrend, while a double bottom should form at the foot of a downtrend.
Two sizable peaks should be clearly visible for the double top, while the double bottom should form two distinctive toughs.
The price action must break below and retest the neckline. In this case, the neckline support level becomes resistant. Similarly, the price should break above the neckline when trading a double bottom.
Using an intraday chart to identify these patterns can be confusing. You should therefore aim to use them daily and weekly time frames. High probability setups can take up to 3 months from the troughs to form.
When the formation appears, you should use other tools for confirmation. Essentially, the fundamentals should support an impending price reversal.
Learn More Open Account Windows/ App IOS/ Android
Where Do You Place the Take Profit?
The most conventional method of setting the price target or taking a profit points is by measuring the size of the chart pattern. Put differently, measure the length between the neckline and the highest peak in pips. The number of pips should be your take profit target.
When trading the double bottom, the swing low formed by the trough will give you a suitable profit target. Like in the double top, measure the pips between the neckline and the peak of the chart pattern and enter the pips as your price target.
Where Do You Set the Stop Loss
There are numerous ways of setting the stop loss.
1. Several Pips From the Swing Low or the Swing High
The first way is to set the stop loss above the double top's peak or below the double bottom's troughs. But there is one problem. Remember, the rule of the thumb is to trade setups that give you more than a 1:3 risk to reward ratio. Using the number of pips between the peak and the neckline to set the price target would mean that your risk equals the reward. This goes against the trading rule. If you book 50% wins, you will always be at break even. It, therefore, necessitates a more conservative risk management method.
2. Exit When the Pattern Is Invalidated
The whole idea is to enter the trade when the signal is confirmed. Put differently, the price must break below the neckline after the pattern is complete.
So, is there really a need to continue holding onto losses if the market invalidates this signal confirmation? It does not make sense. Allow me to explain using a double top.
The ideal way to open a sell trade is when the market breaks below and retests the neckline, support cum resistance. So the signal fails when the price makes a false break below the neckline but reverses and resumes the uptrend. If it reaches halfway the chart formation, the prudent thing to do is exit the market. In this case, the market could be resuming the initial uptrend. The same case applies to the double bottom.
You will also want to monitor the volume closely. In a double bottom, the volume tends to increase indicating a rising buying pressure and confirming a successful double bottom chart pattern.
Trading Double Top and Double Bottom Like a Pro
Some traders complain about good sets ups that eventually fail. If you are also a culprit, you need you should also play with the psychology of the players below.
For instance, an ideal setup should take time to form. This means there is a substantial distance between the two peaks or troughs. The bigger the gap the better.
However, patterns that take longer to form also attract a lot of attention from traders. In the case of a double bottom, you might notice the second trough pierce below the first swing low to trap sellers and “greedy” bulls.
Essentially, you should never chase a breakout. Instead, wait for a build-up of buying or selling pressure. This means waiting for the price to break out from the neckline and experiencing a weak pullback characterized by small-range candles.
This gives you a higher probability trading setup because it shows the traders’ strength.
It also gives you a favorable risk to reward ratio. Therefore, do not chase the market if the price makes a sudden breakout. In fact, you won’t have a logical stop loss level and a small pullback and reversals will stop you out.
Seasoned and prudent traders wait for the price to retest the breakout level (neckline). The resistance turns to support and vice versa. Now enter the market when the market posts a bullish reversal candlestick pattern (bearish candlestick for the double top). You can also include moving averages, RSI, and ADRs to filter accurate patterns.
Trading Example

The picture shows the price movement for XAUUSD. According to the price action, the price is coming from a strong uptrend. It experiences a minor reversal which indicates the buying pressure is losing steam.
The currency pair then rallies creating a new swing high which becomes the first trough. The price then declines and finds support which now becomes a neckline. In fact, the neckline forms in an area of interest that was previously a resistance area. After the second peak, the price breaks out below the neckline.
This is where it gets interesting. After a break out the price comes back to retest the neckline giving you an ideal selling signal. And there you have it a great market entry point. You can easily set a stop loss above the new swing high.

After the currency pair price comes to retest the neckline, a bearish candlestick stick appears. To be specific a pin bar, Doji and harami all indicate the price is warming up to a reversal. Enter the trade at the close of the bearish candlestick pattern.
Below is a real market double bottom formation

Final Note
The double top and double bottom are among the most accurate reversal chart patterns. The most reliable formations appear in a higher time frame. You can also incorporate other trading tools to establish confluence and better trade entry points. Go catch those pips!
Consider using other technical tools to establish confluence and give you more trading confidence. Use Mitrade forex app to practice your trading skills!
Learn More Open Account Windows/ App IOS/ Android
* The content presented above, whether from a third party or not, is considered as general advice only. This article should not be construed as containing investment advice, investment recommendations, an offer of or solicitation for any transactions in financial instruments.

- Original
- Trading Analysis

.jpg)
.png)


Risk Warning: Trading may result in the loss of your entire capital. Trading OTC derivatives may not be suitable for everyone. Please consider our legal disclosure documents before using our services and ensure that you understand the risks involved. You do not own or have any interest in the underlying assets.