 Scan to Download
Support and Resistance Guide: The Ultimate Strategy of Finding Profitable Market Entry and Exit Points
Every trading expert will tell you to open buy and sell trades at the support and resistance levels. The reason is that instruments tend to pause and reverse around these points. Therefore, many traders enter and exit the market at these points.

These zones are areas of interest because of the high concentration of buyers and sellers and typically act as price barriers.
Remember, the price tends to move haphazardly, up, down, or sideways - an ebb and flow. We can make sense of the support and resistance by identifying areas where the price bounces high or retraces downward. Support and resistance form the foundation of technical analysis and market understanding.
In this article, we will take a low gear to explain the resistance and support levels and how to identify and trade these levels.
Understanding Support and Resistance Levels
What are resistance and support levels? This is pretty much a common question.
Think of the resistance as a ceiling -the upper trading limit where the price is likely to encounter a challenge. In other words, the price is unlikely to break above these levels. Many sell orders are located around the resistance zone as bears wait for an opportune time to jump into the market.
The support is the complete opposite. Theoretically, the support is a floor of the price action. There are usually many long position orders around the support levels. Put differently, the price experiences difficulties penetrating or breaking below this level. Usually, the price pauses due to increasing buying interest. The demand makes instruments bounce off the support level. This means buyers jump into the market when the price approaches this level.
Many trading strategies are based on support and resistance levels, and it is a great starting point for analysis if you are a beginner trader.
Note that support and resistance levels are not necessarily points but zones that range several pips. You should get ready to enter or exit a trade when the market nears this zone.
You can use Mitrade forex app to practice your trading skills!
Finding the Resistance and Support Levels
There are numerous ways to identify support and resistance levels. Essentially, analysts use technical analysis indicators to find these areas where the price tends to stop, consolidate and reverse. For example, round numbers act as psychological support and resistance levels.
The price will most likely react to these important levels on the market charts. For this reason, traders contemplate placing a sell order when the price hits the resistance level and buy when the price reaches a support level.
Why Are the Levels Useful to Traders?
Understanding how to identify and use support and resistance lines is paramount to traders. It directly affects the market entry and exit levels.
Everything about the support and resistance levels, including their benefits, will go down the drain if you are not conversant with drawing the lines.
Essential Tips and Considerations
You can easily draw support and resistance lines simply by connecting two points. It is one area in the price chart where you can predict the future price of an instrument. Typically, the supports and resistance levels are horizontal levels that connect previous important points.
You have to ensure the lines are well-drawn by connecting various levels, at least three points. A level that connects numerous points is more significant. Every time the price hits this level, it reacts.
But it isn't obvious that it will reverse every time the price hits these areas of interest. In some cases, the price surpasses the resistance and breaks below the support.
In this case, the support becomes the resistance. Similarly, during a downtrend, it is common for the price to break below the support, which becomes the resistance.
You will want only to choose the high-probability support and resistance areas. Luckily, various techniques and indicators can help you identify the best support and resistance levels.
How to Identify and Draw Support and Resistance Levels
1. Horizontal Support and resistance
These are conventional support and support areas drawn by connecting price levels with a simple line. As a rule of thumb, a line must touch at least two critical points of interest. They are simple to draw, easy to use, and visible with the naked eyes, making horizontal supports and resistance levels the most commonly used trading tool. The price action tends to bounce off the horizontal line immediately every time it nears the line. Exceptions are when the price breaks above or below the line.

The USD/CAD chart shows excellent support and resistance in play. According to the chart, the market pierces through the support fast but closes well above the support line.
At the moment, the price is approaching a resistance level. The market is expected to reverse after hitting support at the 1.2452 level. However, you should allow the market some leeway of several pips.
As you can observe, the currency pair has already touched the line. Whether it will reverse immediately or breakthrough is a wait-and-see situation. Nevertheless, the 1.2878 is clearly a resistance zone.
2. Trend lines and channels
Unlike the horizontal support and resistance lines, trend lines are mainly diagonal. You see, the market could be ranging. This means that it is trading horizontally. However, when the market is trending, the price action moves upwards or downwards in a slanting position due to the time factor.
Trendlines connect price points with a trendline, creating a high probability line where the price is likely to bounce off. A trendline could connect up to five swing lows or swing highs. The more times the price touches the trendline, the stronger the signal is.
Remember, we draw a connecting line that forms a resistance or support level. Typically, prices should touch the trendline at least three times. But one that touches more than five times tends to give the best signals.

This chart shows the price action for Apple stock. It is clearly on a downtrend. Notice how the market finds support along the trendline. This means traders can take advantage of these support levels to benefit from rallies. These are points where the price bounces off and an ideal place to enter the market and add positions if you want to buy low and hold the stock.
3. Trading Channels
Price channels are created by two parallel trend lines, the upper line making the resistance while the lower line represents the support. Essentially, if the price is in a horizontal or ranging direction, the channel makes a rectangular chart pattern. But during a downtrend, the channel is referred to as a descending channel, while an ascending channel signifies an uptrend.
While the price bounces off after touching the trendline, you should allow slight deviation because the price might move slightly above or below the lines.

The Alibaba stock on a weekly time frame is an ideal example of a stock chart trading within the channel but within a clear downtrend. To short the stock, you will want to enter or add positions on the resistance level indicated by the red circles. But the price goes up and down within the channel. The support levels show where the market begins to rally.
4. Fibonacci Levels
Perhaps one of the most accurate technical tools for identifying areas of interest is the Fibonacci level. Named after an Italian mathematician, Leonardo Fibonacci, the Fibonacci level has been observed in natural elements.
The levels are derived from the Fibonacci sequence, a sum list of the two previous numbers starting from 0 and 1. The sequence is 0.1, 1, 2 ,3, 5, 8, 13, 21… When you divide a number in the sequent with the next number, you get 0.618, christened the Golden ratio. This number occurs naturally in the human body and nature, for instance, in seashells.

The CAD/CHF on a 4- hour chart shows how the currency pair behaves after hitting a 50% Fibonacci level. The market was on an uptrend before retracing to hit one of the most significant levels. After finding support in this area, the market has resumed an upwards trend.
The key Fibonacci retracement levels are 38.2%, 50%, and 61.8%, while 127.2% and 161.8% provide the most important extension levels. The price tends to rise past this level greatly.

A weekly time frame of the Twitter share price shows the value is growing. An uptrend reflects this. However, the market has reached a 50% Fibonacci level.
As you might notice, the price has found resistance, and there are indications it could decline if the pin bar is anything to go by. In fact, the market has retested the point again. But there is no certainty of what could happen. There is a likelihood the market could break out and perhaps find resistance in the 68.1% area or continue rising.
5. Moving averages
Moving averages are technical trading tools that show the price direction by calculating the average price over a certain period. It is one of the best indicators for technical analysts.
The most common moving averages are the simple moving averages and the exponential moving average. For instance, the 200-EMA, 100- EMA, and 50 EMA are very popular for trading. In addition, you can tweak the period to enhance how the MA reacts to price. For instance, long periods MA gives better signals because they are not susceptible to market noise.
But did you know that the price also reverses after hitting moving averages? Yes, traders draw moving averages on the charts to show the support and resistance levels. They give better signals when used with other technical tools.
The moving averages are dynamic support and resistance levels that change with every tick.

In the one-hour timeframe, the chart shows the price movement for Google stock. Notice how the price finds resistance on the 50 EMA. You will want to short the stock as the price touches the moving average.
6. Swing Levels
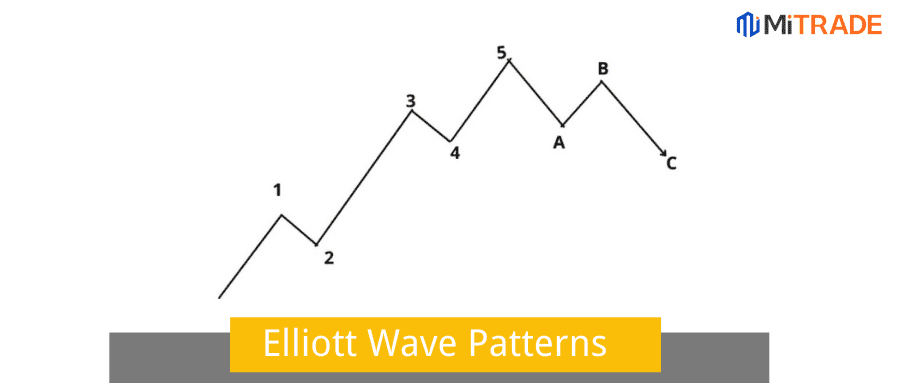
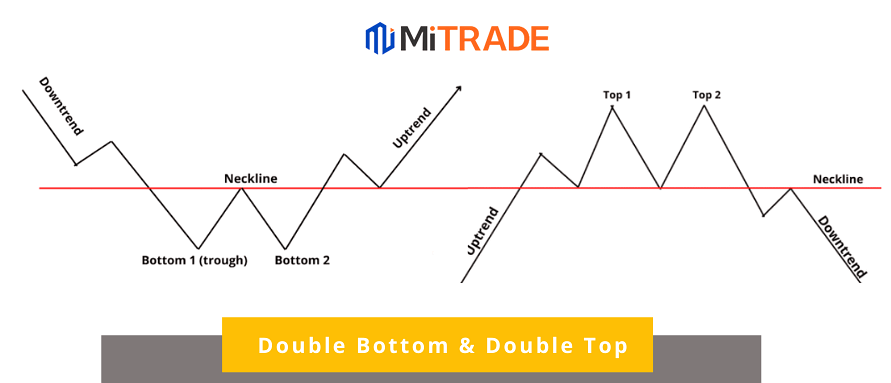
You already know that the price moves in waves. Put differently, the price moves up and down within established trends. Once it peaks, it declines and rises after hitting the bottom.
Swing high peaks before the price retrace, while the swing low is the bottom of the price before it climbs. You don't have to necessarily use any tool to identify the swing low and swing highs. Simply mark the area where the price has reversed in the past. If the price has hit this level significantly, the levels are strong.

7. Round Numbers
The forex market is largely an interplay of traders' psychology. You master the psychology of the market participants, and you will be amazed at the profits. Essentially, round numbers create psychological resistance and support levels.
You probably wonder why the zones of interest would form around round numbers. The simple answer is that traders tend to place their stop losses and profit targets around the round numbers. This means many orders and market participants coalesce around the levels.
Take an example of the Euro against the US dollar EUR/USD pair, which is trading at 1.05651 in a downtrend. Most bulls have likely placed the target of their long positions at 1.0600, targeting a modest 35 pips. You might therefore experience accelerated activities around the level.

How To Trade Support And Resistance Levels
There are two trade resistance and support lines: the break and the bounce.
Bounce
One way of trading the support and resistance levels are waiting for the price to bounce off the resistance or support level. Many traders, especially rookie traders, set the trade entry points directly on the line. They hope the price will respect the levels, perhaps even before reaching this point. This is quite a mistake.
This begs the question, should you place the entry point right on the line? Well, let's find out.
Before opening a market position, prudent investors ensure the trade is in their favor. This means finding a confirmation the signal will hold.
The whole idea is to wait for the price to bounce rather than trading off the bat. You will also want to avoid instances where the price pierces fast through the resistance or support areas.
Breakouts
In an ideal world, traders would enter the trade at the resistance and support zone. But in some cases, the price breaks these levels. There are two ways to go about when the market breaks below or above the resistance and support levels.
You can either go the conservative or the aggressive way.
The Aggressive Method
The aggressive way involves entering the market immediately when the price breaks through the resistance and support zones. This means it should surpass these zones with ease and minimal resistance. The signal should be convincing enough.
The Conservative Retest Method
Now in trading, you should always find an edge. This method gives you exactly that. Remember, these demand and supply areas have massive orders as traders await to enter the market. Therefore, you should wait for the price action to break the line and retest it. In this case, the support turns to resistance while the resistance turns to support. Otherwise, you risk getting trapped and suffering losses from fake breakouts.

Tips to Make the Most Out of Support and Resistance Zones
Here are some tips to help you get a high winning rate when trading using the resistance and support areas.
Use time frames that suit your trading strategy the most. Areas of interest drawn on a higher time frame tend to have a higher winning rate and are less susceptible to market noise. However, you can use a lower time frame if you are an intra-day trader or scalper. Better still, it is advisable to use a multi-frame trading technique to identify long-term and short-term support and resistance zones.
It is advisable to use the most recent support and resistance zones. However, the market remembers even earlier areas of interest and respects them. When using higher time frames, pay attention to essential areas in the last 12 months.
Candlestick charts tend to give the best signals. The candlestick shows the opening, closing, high, and lowest of a trading session. You can either use the wick or the body to draw the support and resistance lines.
Do not remove trend lines when the price breaks above or below them. They change roles once broken. In many cases, the resistance turns to support level and vice versa.
Support and resistance levels are zones and not necessarily a point. This means that the price action will react when it reaches this level. Therefore, you should place your stop loss several pips above or below the support and resistance lines.
The support and resistance levels form the basics of the price action trading method. It is one of the most used tools by technical analysts to determine market entry, exit points, and risk management. Finding areas of interest can fundamentally help boost your trading results.
How to Draw Support and Resistance Line
The first thing is to identify a swing low or swing high and where to place the horizontal line. Remember, the support and resistance line should be obvious where a price recently reacts. Now connect two swing high swings or lows with one and extrapolate it into the future. In simple words, extend the line past the current price to view the likely support and resistance levels in the future. However, it is imperative that the price touches the line at least three times.
Draw the Lines on the Mitrade platform

Mitrade trading platform comes with charting tools that help you draw support and resistance levels. Whether you are drawing trendlines, moving average or horizontal lines, the web platform makes analysis and finding ideal entry and exit trades easy. Here is a guide on drawing the support lines on the trading platform.
Step1: Register ——To use mitrade, you need to sign up here. You can opt to use an email address or mobile number to sign up and set the password.
Step2: Choose trading pairs——Mitrade comes endowed with an array of trading assets. It gives you access to over 300 commodities, stocks, CFDs, indices, cryptocurrencies, and forex.
Step3: Click the toolbar on the left——There are 13 types of tools that help you draw trend lines. Mitrade also offers hundreds of indicators to refine your technical analysis.
Horizontal Line
Select the horizontal line on the toolbar and click anywhere on the chart to draw a horizontal line. The line will appear on the chart showing areas where the price will have difficulties breaking.

Trendline and Channel
Similarly, hover over the toolbar and choose a trendline or a parallel channel. Click where you want to draw these analytical tools. You can move the trendline or channel to coincide with the swing highs and lows simply by clicking on the lines.

Moving Averages
Click on the indicators menu and a myriad of indicators will appear in alphabetical order. You can scroll down or use the search bar to locate the moving average. Click on the moving average and it will appear on the chart automatically. 
Conclusion
The support and resistance levels are the basics of technical analysis. The markets tend to respect these areas. If the price hits the resistance area, it will bounce off and reverse. Similarly, the price reverses when it hits the support. There are numerous ways to draw support and resistance areas. You can use Fibonacci levels, moving averages, trendlines, and channels.
However, it is not a cast-in-stone rule that the market will reverse every time it hits this level. Sometimes, it breaks the levels, and support turns resistance and vice versa. Therefore, you should use other technical tools and fundamental analysis to confirm the signal and establish the confluence.
In a nutshell, keep an eye on market behavior near the zones of interest and act accordingly.
FAQ
● How do you identify a support and resistance zone?
The support is the area below the current price where there is buying interest, while the support is the area above the price with high selling pressure. The price tends to reverse at these points.
● How do support and resistance work?
The price tends to pause temporarily due to the concentration of demand and supply. Traders can enter the trade as it reverses or breaks out above or below the lines.
● What causes support and resistance?
The support and resistance are caused by the demand and supply of a certain instrument. The support forms in areas with massive demand, while increased supply creates resistance. This makes it hard for prices to surpass these areas.
* The content presented above, whether from a third party or not, is considered as general advice only. This article should not be construed as containing investment advice, investment recommendations, an offer of or solicitation for any transactions in financial instruments.

- Original
- Trading Analysis

.jpg)
.png)


Risk Warning: Trading may result in the loss of your entire capital. Trading OTC derivatives may not be suitable for everyone. Please consider our legal disclosure documents before using our services and ensure that you understand the risks involved. You do not own or have any interest in the underlying assets.