 Scan to Download
Elliott Wave Patterns: How to Ride the Waves to Profitability

Elliott Waves is a theory that belongs to technical analysis. American accountant Ralph Nelson Elliot developed the Elliott wave theory. Elliot discovered there is more in the market than meets the eye. While other traders saw chaotic formations, he discovered common patterns in every market.
This guide seeks to explore the Elliott wave patterns. By the end, you will be a guru. However, you need to put the theory into practice to reap results.
What is Elliott Wave theory?
Elliott wave theory (Elliott waves) is also often referred to as wave theory. It supposes that the market moves like tidal waves, one wave after another, and since the patterns recur repeatedly, it is an ideal tool for predicting the future price movement.
Essentially, the Elliott Wave Theory (EWT) states that market movements follow the natural sequence of the psychological cycles of the crowd.
EWT is mainly used to determine the stage of the trend and whether the trend has reversed. However, it is often used with other technical analysis indicators because it is difficult to use for accurate analysis.
Elliott Wave is not an indicator or trading technique. It describes in detail how the market behaves.
The basic structure of the wave theory: ● In a bull market, there are 5 rising waves and 3 falling waves ● In a bear market, there are 5 falling waves and 3 rising waves, which form the overall stock market cycle. |

Nine Degrees of Waves
As mentioned, the waves appear in short-term and long-term charts. Therefore, Elliott divides the waves into nine subcategories depending on the period.
● Grand supercycle- a multi-century cycle found in monthly and weekly timeframes
● Supercycle- A multi-decade cycle forming after 40 to 70 years
● Cycle - extends from one year to several years, sometimes in several decades
● Primary - a cycle that takes months or several years to form
● Minor- Extends several weeks or a few months
● Minor - A minor cycle completes its formation after several weeks
● Minute - A cycle that completes formation in several days
● Minuette- the waves are observable after hours
● Sub minuette - A cycle based on minutes and observable in 1-hour time frame
Since smaller patterns can be identified in the bigger patterns, you can, therefore, use the pattern to identify trading opportunities that offer suitable risk-to-reward ratios.
The Basic Principle of Elliott Wave
The basic structure of the Elliott wave is a wave formation consisting of five motive waves in the direction of the larger trend followed by a corrective three-wave formation going against the higher degree trend (5-3). The price advances high or down as the waves advance.
The five waves of the motive wave are labeled 1,2,3,4, 5, while three-wave corrective waves have labels a,b, and c.

Waves 1,3,5 move in the direction of the main trend and are therefore motive waves. They are also referred to as actionary sub-waves. Remember, the motive waves move in the direction of the larger trend. Waves 2 and 4 move in the opposite direction of the main trend and correct the motive waves.
The larger corrective wave has a three-wave structure labeled ABC. It is also a motive wave moving in the direction of a higher degree trend. A and C are motive waves, while B is against the trend hence corrective.
The formation finishes at a higher price during an uptrend than it started during a bull market. Ultimately, the expectation is that the market will form another five-wave structure after the end of the correction.
Note that the movement does not always signify an uptrend. During the bear market, the downward trend is more dominant. The price advances lower and corrects upwards. Put precisely, the price will form five waves downwards and three waves upwards. Therefore, the motive wave has five waves down and corrective three waves up.
The impulsive move is in the direction of the trend. After the complete formation of the five-wave motive wave and three-wave corrective wave, a whole cycle is deemed complete. The motive and corrective waves alternate with each other.

Motive Waves
The motive moves in the direction of the primary trend. There are three more variations which include the following:
● Diagonal motive wave
● Impulse wave
● Impulse with extension
In fact, the motive wave is more correctly referred to as motive sequence due to these variations.

The impulse wave has a typical formation of five waves, three motive and two corrective waves. The impulse with extension has elongated impulses simply referred to as an extension. Essentially, these impulses are mini waves that occur in any motive wave 1,3,5 but are usually found in the third wave for stock markets. However, these extensions appear on the fifth wave in the commodities market.
The diagonal motive wave can either be a leading or ending diagonal wave. As the name suggests, the leading diagonal appears as a subdivision of wave 1 in impulse wave or wave A in zigzag. It also takes a wedge-like formation. In contrast, the ending diagonal appears as a subdivision of wave 5 in an impulsive wave or C in a zigzag.
Motive Sequence
Motive waves do not necessarily have to be in impulse, but they move in the primary trend direction. This is why we prefer calling them a motive sequence, an incomplete sequence of waves that can also be corrective. Depending on the sequence of the waves (swings), you can expect it to extend in the existing direction.

Like the Fibonacci sequence, the current trend is likely to extend if the number of swings is in the motive sequence. The motive sequence is 5,9,13,17,21,25.,29.
Corrective Waves
Corrective Waves Rules of Formation
●Wave 2 should not retrace more than 100% of the first wave
● Wave 3 can’t be shorter than the motive wave
● Wave 4 should be above the last point of the first wave.

Corrective waves move against a greater degree trend and tend to be less identifiable than impulse waves because they come in myriad varieties. Corrective waves can appear in trends and countertrends. Essentially, they move in three, never in five.
The corrective patterns can be divided into:
Zigzag
The zigzag corrective wave consists of three waves ABC. Waves A and C contain five impulsive or diagonal waves. Wave b is corrective. Generally, it takes the structure of 5-3-5 waves.
Flat
Just like zigzag, the wave has the label ABC. However, it takes a 3-3-5 structure. The first and third waves have a subdivision of 3 waves, while wave C has five waves.
Triangle
Triangles tend to move sideways and have a 333 structure.
Double Three
Doubletree combines any two of the flat, zigzag, and triangle formations.
Triple Three
Triple three combines three of the corrective patterns.
The Personality of Each Wave
Waves | Characteristics of Elliott Wave |
Wave 1 | The first wave is almost undetectable. The motive wave is just starting to form. In fact, the fundamental news is still negative, and there is a sentiment in the market that the previous trend is strong. The fundamental analysts revise earnings estimates lower, the economy doesn't look strong, and surveys give bearish sentiments. However, the volatility is high, but the rising volume is not enough to alert the technical analysts. |
Wave 2 | The news still doesn't look promising, and bearish sentiment is hovering in the market as the prices retreat from the previous swing high. However, there are signs for keen analysts. The corrective second wave can’t extend more than 61.8% of the first wave. In addition, its volume is less than the first wave. |
Wave 3 | Wave 3 is the most extensive in the five-wave formation. It extends 1.618% of wave one. The market news is positive, and analysts are increasing the earnings estimates. At the beginning of the wave, the news might be bearish, and some traders are in the loss zone. Somewhere along the midpoint, the crowd joins the trend increasing the momentum. As the rally increases, it takes out the stop losses of wave two. Now the rally is more noticeable and catches the attention of traders. |
Wave 4 | Wave four is a small corrective wave. It offers traders an opportunity to enter the trade at a pullback. The volume reduces than during the preceding wave, and you might experience a more sideways move. The rally sets in at the end of wave four and is a great time to capitalize on the benefits of potential wave 5. |
Wave 5 | According to Elliott's wave theory, this is the last wave of the cycle. The volume is less than in wave 3, and you will start noticing divergence in momentum indicators. The indicators do not reach a peak despite the price hitting new highs. The general sentiment in the market is bullish, and many average traders jump into the market. The wave surpasses the high of wave three, but the strength and enthusiasm are relatively low. |
Wave A | Detecting wave A can be quite challenging. There is increased volume; to most analysts, it is just correcting the already bullish market. But in essence, it marks the beginning of a bear market. |
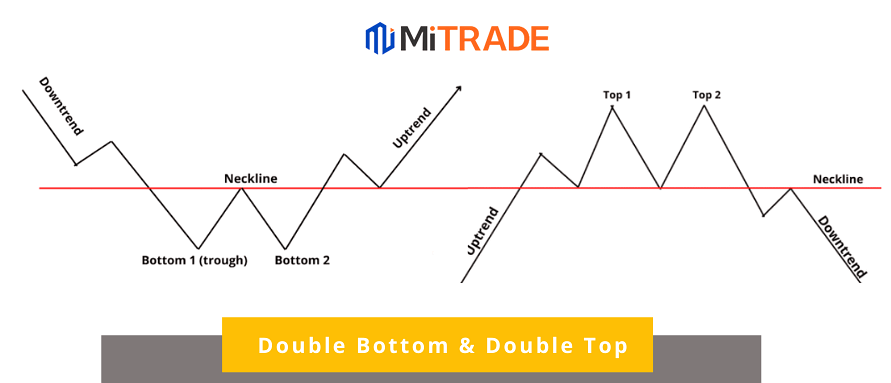
Wave B | While the volume reduces than in wave A, many interpret the wave as a resumption of the initial bull trend. While the fundamentals are not negative, they are not improving either. For technical analysts, wave B might appear like the second shoulder of the head and shoulder pattern. |
Wave C | By now, it is obvious to everyone that the market is bearish. The wave is at least equal to wave A. It might extend more than 1.618 of wave A. |
The Relationship Between the Elliott Wave and the Fibonacci Ratios
In the thirteenth century, an Italian mathematician, Leonardo Fibonacci, discovered the Fibonacci sequence after studying the pyramids of Giza. The sequence starts with zero and one. If you add the two subsequent numbers, you get a Fibonacci sequence. But it gets interesting. Dividing a Fibonacci number with another Fibonacci number gives a Fibonacci ratio.
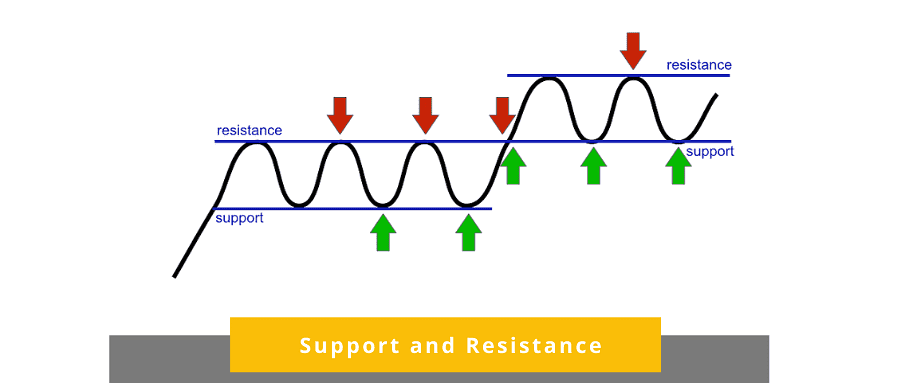
Fibonacci ratios create strong resistance and support levels in the market and appear naturally as petals, seashells, music, architecture, and geometry.
One of the key Fibonacci ratios is 0.618, derived from dividing a Fibonacci number with the one that follows it in the sequence. The rations are expressed as percentages, i.e. 61.8%.
Integrating Fibonacci levels in the Elliott wave theory can help you accurately predict reversal points. The wave structure tends solto have a relationship with the ratios.
How Fibonacci Ratios Work in Elliott Wave Theory?
● Wave 2 is a 50% to 85.% retracement of wave one (including 61.8%)
● Wave 3 extends 161% of the first wave
● Wave 4 is a small pullback, typically between 14.6% to 38.2%
● Wave 5 is equal to wave 1, 1.236%- 1.618% of wave 4, and 61.8% of wave 1 plus 3
You can therefore use these Fibonacci levels to determine the right trade entry points.
Fractal Nature of Elliott Wave
The Elliott wave theory has a 5-3 structure. In the motive phase, there are five waves. Within the first wave, you will notice another five-wave structure and three-wave waves on the second wave of the bigger wave. Essentially, similar patterns form on a smaller scale and a larger scale.
A fractal is a part of a geometric or curved figure with the same statistical characteristics as the whole. The pattern occurs when the wave structure expands and contracts. To put this in clear terms, you will observe the 5-3 formation in the bigger structure.
As per Elliott's theory, the market is fractal in nature. Regardless of how small or big the wave degree is, the motive wave is formed by a 5-wave sequence, while the corrective wave consists of 3 waves. The celebrated accountant noticed that the patterns forming on higher degree trends are mirrored in lower trends.
How to Use Wave Theory in Trading?
Elliott's wave theory suggests that by studying historical prices, one can reasonably predict stock price movements. Because the market is driven by investors' emotions, it will move in waves, and there are some points to note when you use it.
1. The principles of wave theory rely heavily on market sentiment and I suggest combining the fear and greed indices to see if there are similarities between the index and the trend you are analyzing.
2. Although there are waves when you look back, it is actually very difficult to predict them accurately in advance. If any of the waves do not meet any of the rules, then the wave needs to be recalculated.
3. The best time to use wave theory is to guess that wave 3 has just formed and that it is an opportunity to enter when wave 3 is about to break after wave 2 has ended. If wave 3 forms later, there will be a follow-on trend. However, it is possible to misjudge or fail to break through, or the wave is not really formed.
4. Another opportunity is when the 4th wave ends and the 5th wave is about to start breaking out of the 3rd wave's previous high. At this point, the wave is shaping up with more certainty, but it is risky because wave 5 could end in a reversal at any time.
5. The theory was proposed in the 1930s, and market psychology and crowd behavior may have evolved with the times, so it is worth considering whether it is still in line with today's investment psychology.
Final Note
Elliot wave is very helpful. However, it is not a trading technique. Many traders do not employ it in analysis because they don't understand how to use it to find suitable entry and exit points. However, some traders have developed mastery of Elliott waves and use them profitably.
It is advisable to incorporate technical tools to help you identify the Elliott wave to ease the trading experience.
* The content presented above, whether from a third party or not, is considered as general advice only. This article should not be construed as containing investment advice, investment recommendations, an offer of or solicitation for any transactions in financial instruments.

- Original
- Trading Analysis

.jpg)
.png)


Risk Warning: Trading may result in the loss of your entire capital. Trading OTC derivatives may not be suitable for everyone. Please consider our legal disclosure documents before using our services and ensure that you understand the risks involved. You do not own or have any interest in the underlying assets.