A Comprehensive Guide On Using Candlestick Chart Patterns to Trade Forex Profitably
Perhaps the most appealing attribute of the forex markets is its gargantuan $6 trillion daily turnover. The market is expansive enough to allow traders to make a big buck. While some traders make good money, we can't say the same for others. The difference boils down to market analysis, interpretation of market behavior, and acting on trading signals at the opportune time.
You agree that predicting the future price of an instrument is not a cakewalk, right? But here is some good news. Price action traders can use candlestick patterns to forecast market behavior accurately.
Llewelyn James, a prolific forex writer, opines that market action is better than news. But that is a moot point and besides the point.

Enter the Candlestick Patterns
Candlesticks display all important information about the currency pair prices. The opening and closing prices and the session’s high and low are easily visible for each time frame. Traders can easily discern this information. For instance, if a candlestick closes near the high, the buyers control the market.
One or more candles form a candlestick pattern. All candlestick patterns show the market sentiment and provide excellent trading signals.
Brief History of Candlestick Patterns
Traders have been using candlesticks patterns for eons. The Japanese rice traders first used the patterns back in 1700. They were introduced to western traders by Steve Nison.
Practice your trading skills with a demo account!
Understanding Candlestick Patterns
It is prudent to understand how candlestick form to use the patterns optimally.
● The body - The real body marks the opening and closing price for the period. Usually, bullish candlesticks are green, white, or empty. The price opens at the bottom of the candlestick and closes at the top. On the other hand, bearish candlesticks are filled in black or red. It opens at the top and closes at the bottom. The highest and lowest points of the candlesticks mark the price range.

● Wick/shadow- Wicks are thin vertical lines representing the high and low of the trading session. There is no wick if the opening and close are the furthest points.

How to Read Candlestick Patterns
Using candlesticks doesn't have to be hard. Ordinarily, a candlestick will be at level with previous candlesticks unless there was a gap, especially on a weekend. Reading the patterns involves interpreting the candlestick body and wicks. A small real body signifies weak buying and selling pressure or market indecision. A wide bar, on the other hand, shows high trading momentum.
Candlesticks are also used to show the price direction. If the price closes above the opening, the price moves up, while the price closing below the opening characterizes a downward direction.
Wicks also say much about price behavior. For example, long wicks on the upper side signify increasing selling pressure. However, wicks on their own don’t tell the whole story. You should put the whole price action into context. Getting a candlestick pattern pdf gives you access to valuable information and use it on the go.
Types of Candlestick Patterns
Candlesticks can be categorized into three groups:
1. Bearish
2. Bullish
3. continuation
There are dime a dozen candlesticks patterns. We have created a candlestick pattern cheat sheet to help you recognize and use these patterns in real-time trading. After learning, choose patterns that appeal and suit your trading strategy, and start trading on Mitrade today. You will be laughing to the bank in no time.
Below are the top candlestick patterns you should know. Let’s delve right in.
Practice your trading skills with a demo account!
Bullish Candlesticks Patterns
Bullish candlesticks patterns imply that the prevailing downtrend is ending, and the market reversal to uptrend is imminent. Therefore, traders should be cautious about holding short positions. When these patterns form, it is a tell-tale sign to go long (open buy trades).
1. The Morning star
The morning star is a three-stick chart pattern formed after a downtrend. The first is an elongated bearish candlestick followed by a Doji or small-bodied candlesticks. A bullish candle completes the candlestick pattern.
The bearish candles indicate a continuation of the downtrend, while the Doji signals a dwindling selling pressure and possible reversal. The tall bullish candle implies the buyers have control of the market and will push the prices high. Note that the real body of the second candlestick should form below the real bodies of the bearish and bullish candlesticks. 
2. Hammer
The hammer is one of the most popular bullish candlestick patterns and is easily visible on price action. It appears at the bottom of the downtrend. To give you a clear picture, it consists of a small body with a long wick extending below. The shadow of the ideal hammer should be twice the real body.
So what is the psychology behind this pattern formation? Well, it starts with the sellers pushing the price below the session's opening price. However, the bulls enter the market and advance the price up. The buying pressure exceeds the sellers, closing above the opening price.

3. Inverted Hammer
As the name implies, this bullish signal looks like a hammer resting on its head. You have definitely seen a hammer, right? When the hammer pattern forms at the bottom of the downtrend, you should get ready for an uptrend.
The hammer forms when the price closes near the opening price. After opening, the buyers push the price high, but sellers eventually push the price back. As a result, the candlesticks form a small body and long upper shadow. An ideal inverted hammer should have a long wick double the size of the real body as shown in the candlestick pattern chart below.

4. Bullish Harami
The bullish harami is a two-candlestick formation that appears after a downtrend. How do you identify a bullish harami, you ask? Well, the first candle is tall and bearish, signifying the continuation of the downtrend. However, the selling power diminishes, and the bulls take control of the markets as signified by a small-bodied bullish candle or Doji. The bullish candlestick should be within the range of the bearish candlesticks. This is a tell-tale sign that a bearish trend is reversing, providing an excellent opportunity to go long.

5. Bullish Engulfing
Does the word engulf ring the bell? Probably. The engulfing candlestick pattern is perhaps one of the strongest bullish signals. It is a multiple candle formation consisting of a small, bearish candle and a long bullish candlestick. The bullish candle completely engulfs the bearish signal. What does this market behavior imply? The interpretation is that bears pushed the prices downwards, creating a bearish candle. However, a stronger buying pressure entered the market, pushing the prices higher. You should consider buying at the high of the candlestick formation.

6. Three White Soldiers
You guessed it right! This pattern consists of three candlesticks that conquer sellers and reverse a downtrend. Three white soldiers consist of bullish (white, green, or blue) candles in an uptrend formation. The candlestick must not have a long wick (typically no shadows), and each candlestick should open within the real body of the previous candle. Three white soldiers' candlestick pattern indicates prevailing buying pressure in the market.

7. Piercing Pattern
The piercing pattern is a two candlesticks pattern. Like other bullish formations, it signifies the end of a downtrend and the beginning of an uptrend. But this pattern is quite different. When the first (bearish) candle closes, a significant gap forms before the bullish candle opens. This means the open is relatively lower than the previous session's close. It then advances higher and closes more than halfway the previous candlestick range. Therefore, buyers should be ready to jump into the market after the pattern is fully formed.

8. Bullish Counterattack
When the bullish counterattack forms during a strong downtrend, it signifies a potential market reversal. In other words, the market is set to start moving upwards. The pattern consists of two candlesticks with substantial real bodies - a bearish candlestick is followed by a bullish candlestick. Like the piercing patterns, the bullish creates a gap before opening. Additionally, it closes at the level with the close of the previous candlesticks. Ideally, the two candlesticks should have equal size.

9. Tweezer Bottom
Tweezers bottom form frequently and are characterized by two candlesticks with equal lows. The first candlestick is bearish, and the second bullish. This pattern indicates a lack of enough momentum to lower the price. The lows create a strong support ideal for price reversal. Therefore, traders get an opportunity to open long positions when the uptrend is just starting. The strategy is to wait for tweezers to form before opening a trade and place your stop loss several pips below the candlestick pattern.

Bearish Candlestick Patterns
The Bearish Chart patterns form at the end of an uptrend, signifying that the market is poised to reverse to the downside. You should get ready to open sell trades and close long positions.
1. Shooting star
The shooting star is one of the widely used bearish signals. It indicates the uptrend has diminished, and the selling pressure has surged. Identifying the shooting star shouldn't be a problem. It looks like an inverted hammer and is characterized by a small real body and long upper wick.
The shooting star forms when the market opens and rises significantly. Eventually, the price plunges and closes near the open, forming a big wick. The shooting star has little or no lower shadow. An ideal shooting star comes after three successful bullish candlesticks and the following candle gaps down before a massive down move. Below is a candlestick pattern chart to give you a clear idea.

2. Bearish Harami
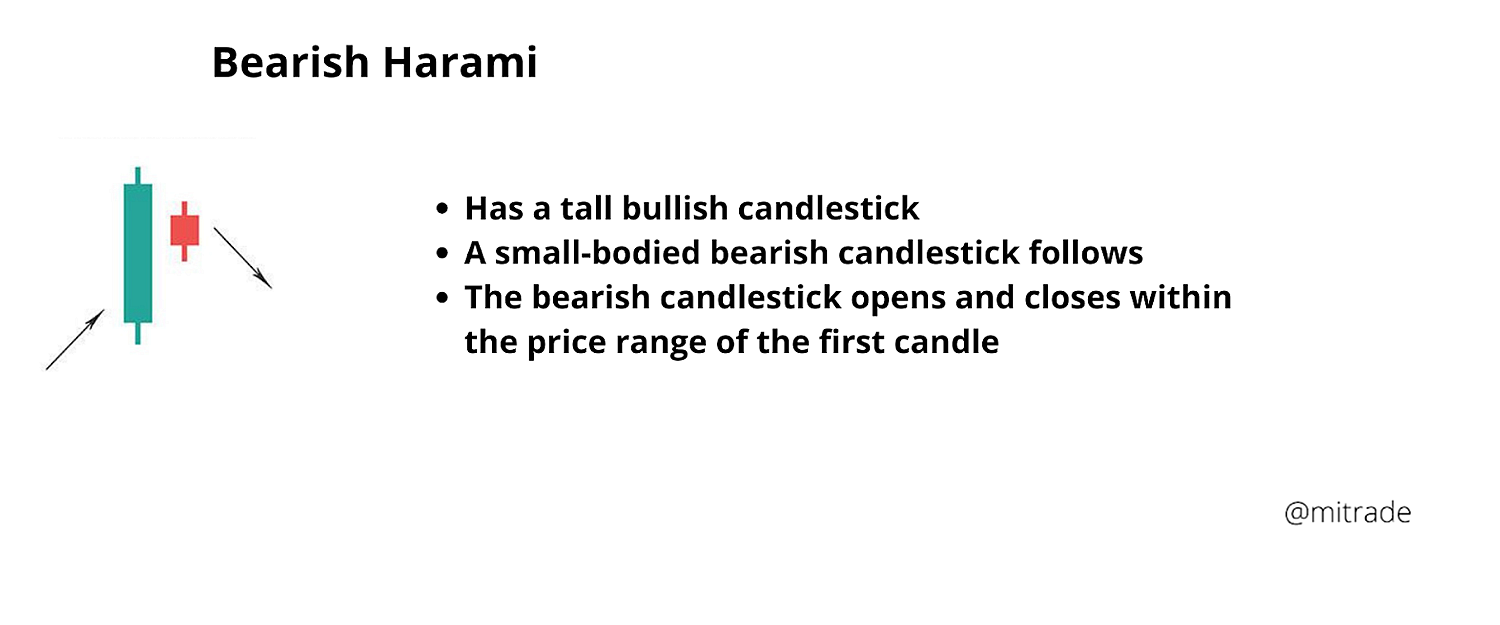
The bearish harami is the opposite of the bullish harami. Essentially, it signifies the buyers are losing positions as sellers take control of the market. Bearish harami indicates that the price could reverse, and traders should look to sell. The two candlestick pattern comprises - a bullish candle that precedes a bearish candlestick. The second candle should open and close within the range of the first candle. Here is a fun fact. Harami means pregnant in Japanese, and the candle formation resembles a pregnant woman. The smaller the second candle, the more potent the signal is.

3. Hanging Man
Imagining a hanging man might not be the most interesting thing. But you can definitely picture a hammer, right? Well, the hanging man price is similar to the hammer pattern, only that it appears at the top of an uptrend. When the hanging man forms during an uptrend, it signifies sellers are back in the market, and significant sell-off is building up.
Understanding the psychology behind the pattern can help trade it with ease. Essentially, hanging man forms when the session opens, and the sellers dominate the market, pushing the prices down. However, the bulls try to push the price upwards unsuccessfully, with the price closing below but close to the open. The results in a small body, little or no upper shadow, and long lower wick.

4. Three Black Crows
Remember the three white soldiers? The three black crows are the complete opposite. They are referred to as black to denote bearish candles, which take red colors on some platforms. As the name implies, this candlestick chart formation consists of three candlesticks with short or no wicks. The three candles have big bodies roughly equal in size. The first candle may gap down, but the rest open within the range of the previous candlesticks. However, the three candlesticks close below the close of the previous trading sessions. The whole idea behind this pattern is that the bears push prices lower, reversing gains by the buyers. When it appears on a daily frame, it means the sellers have overpowered the buyers for three consecutive days.

5. Tweezer Top
Like the tweezer bottom, the tweezer top is a price reversal signal. It is characterized by two consecutive candles with matching tops, either a wick or a real body. This means the candles should have the same heights but different colors, i.e., a bullish candle followed by a bearish candle. The pattern signifies a strong resistance, with bears overpowering the bulls and reversing the upward market direction to a downtrend. This means bulls are not willing to buy at higher prices. Ideally, the first candle should have a big body. The bearish signal is more reliable when the second (bearish) candle is small.

6. Bearish Engulfing
The bearish engulfing is one of the clear-cut sell signals. The pattern gives a strong signal when it forms at the end of the uptrend. The size of the first/ bullish candle is not paramount. In fact, small-bodied candles like Dojis provide the best signals. However, the second candlesticks should be elongated and often precedes a downtrend. It should open above the previous candle's close and close below low, completely engulfing the first candlestick. This shows the selling pressure is higher than buying power. Traders should enter the trade when the pattern forms and place the stop loss above the candlestick top.

7. Dark Cloud Cover
The dark cloud cover provides an excellent signal for downward reversal. Understanding how to use this pattern provides traders with an opportunity to benefit from a great risk to reward ratio. The good news is that it's easy to spot—simply lookout for two candlesticks forming at the top of an uptrend. The first candle should be bullish, followed by a bearish candle. The bearish candlestick gaps up and creates a new high before dropping to close below the midpoint of the previous bullish candle. While it can be confused with the bearish engulfing, Dark cloud cover provides a more appealing market entry point.

8. Evening star
If you spot an evening star pattern, be ready to sell. It provides a great trading opportunity to enter the trade at the start of a downtrend and catch handsome pips. You might be wondering, how do you identify an evening star in the market?
The evening star is a three candlestick chart formation. The first candlestick is a large bullish candle signifying a buying order. However, another small candle, usually a Doji, appears hinting fatigue in the trend. This candlestick could be bullish or bearish and often gaps upwards. Eventually, massive bearish candle forms revealed the beginning of a downtrend. Lower highs and lower lows usually follow the pattern. You should, however, integrate risk management in your trading by using stop losses.

9. Bearish Counter Attack
When the bearish counterattack forms, it can lead to a swift, massive downtrend. The pattern starts with a strong uptrend, and buyers feel pretty confident about the momentum. Despite being a bearish pattern, it starts with jubilation as the price jumps and gaps up. But things take a different turn as the next candlestick opens above the closing of the previous candle and moves downward, closing at or beyond the closing previous of the previous candle. This signals the sellers are back in the market, and selling momentum could prevail in the series of trading sessions. Traders should consider closing their long positions and look to enter short trades.

Continuation Candlestick Patterns
Continuations can form during a downtrend or uptrend. It is common for a strong trend to “rest” and enter a consolidation phase. Not all trends reverse after dwindling; others resume their original trend. If the trend forms a continuation candlestick pattern, you consider adding more positions.
The continuation candlestick patterns typically move sideways in a consolidation phase. When they form, traders should get ready to enter the market in the original trend direction. Below are the top continuation patterns you should be familiar with.
1. Doji
The first candlestick pattern in this segment is the Doji. Dojis are quite popular and widely used for a good reason. The Doji happens when the currency pair opens and closes at the same levels. The result is a cross-like shape featuring long shadows. The Doji signifies a tug of war between the buyers and sellers. Buyers push the prices upwards, and sellers reject the higher prices pushing the prices lower. There are no clear winners in this contention, indicating indecision in the market. Doji as a standalone pattern is a neutral signal.

2. Three Methods
The three methods pattern is a five candlestick formation encompassing the rising and the falling three methods. When it appears on an uptrend, it forms a rising three methods pattern while the falling three methods appear in a downtrend. This pattern signals an interruption rather than a trend reversal.
The rising three methods borrow its name from three candlesticks contained in the pattern. But in essence, the pattern consists of five candlesticks. Two long candlesticks in the trend direction and three short candlesticks in between.
Rising three methods start with a bullish candle followed by three short-bodied candles within the range of the first candlestick. The last candlestick opens above the previous candle's close and closes above the close of the first candlestick.
Similarly, falling three methods features a long bearish candlestick followed by three short candlesticks. The last candlestick is bullish and opens below the close of the previous candlestick and closes below the close of the first candlestick.
Once you spot this pattern, expect the trend to resume. It might be a good idea to add up positions.

3. Spinning Top
Spinning is a neutral pattern that indicates market indecisions. It is almost similar to Doji but has a bigger body. The general market interpretation is that this pattern represents consolidation or “resting phase” before the original trend resumes. The bull pushes prices upwards while the sellers send the prices falling. However, the price closes near the open, forming a small body that is vertically centered. The buying and selling momentum is almost at equilibrium.
Essentially, the pattern means there is insufficient pressure to reverse the original trend. In this case, it is better to watch from the outside. The indecisions signal the sideways movement might continue.

4. High Wave
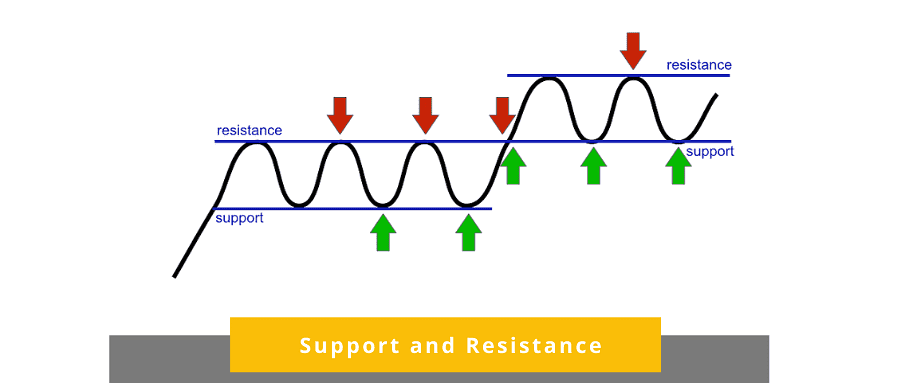
The high wave candlestick pattern is characterized by a small body with big upper and lower shadows. They have bigger bodies than Doji and longer wicks than the spinning tops. The long wicks denote massive and rapid price movements as buyers push prices higher and bear increase the selling pressure. As both sides battle to push the price in their direction, none can hold on to their gains by the end of the session. As a result, the prices close near the open. The candlesticks usually form in a resistance and support area. It signals indecision and hence a neutral indicator.

5. Tasuki Gap
Last on our list, we have the Tasuki gap, a continuation candlestick pattern. The upside Tasuki appears on the uptrend, implying upward move will continue, while the downside Tasuki is a telltale sign that the bearish trend could go on. The identifying feature of the Tasuki candlestick pattern is a gap between the first and second candlestick with a third counter candlestick closing the gap.
Upside Tasuki gap has a long-bodied bullish candle followed by another bullish candle that gaps up. A bearish candle then forms, bridging the gap between the two candlesticks. This signals that the uptrend will resume, and you should get ready to enter a buy position.
The downside Tasuki occurs when an elongated bearish candle is followed by another bearish that forms after a gap down. A bullish candle closes the gap completing the patterns and signaling a potential resumption of the downtrend.

How to practice trading with Candlestick patterns on Mitrade?
Understanding how the candlestick patterns form and learning how to use them perfectly is a step in the right direction. With these patterns at your fingertips, you are set to reap profits off the forex market. But there is a small hurdle. You need time to understand, internalize and perfect the use of candlestick patterns and even develop a clear trading strategy based on the patterns. Yes, practice makes perfect, and forex is no different.
However, many traders, especially rookie traders, are reluctant to practice using real accounts. The prudent thing to do is perfect your strategy before risking your hard-earned money. This is where the Mitrade demo account comes in handy.
Once you sign up, you receive virtual money and start trading in a real market simulation. You can backtest and forward test, keeping note of the market behavior after a pattern formation. The demo account allows you to open trades after the patterns appear and analyze your winning rate.
The ball is now on your side. Open a demo account on Mitrade today, begin practicing and be on your way to becoming a successful, profitable Forex trader.
Here is how you go about opening a demo account:
Step1: Register ——To use mitrade, you need to sign up here. You can opt to use an email address or mobile number to sign up and set the password.
Step2: Choose Account——Once you log in, you will see a menu at the upper right corner that allows you to choose between a demo or a real account. Select the demo account if you want to practice. Similarly, you can opt for a real account if you want to start trading immediately.

Step3: Choose trading pairs——Mitrade comes endowed with an array of trading assets. It gives you access to over 300 commodities, stocks, CFDs, indices, cryptocurrencies, and forex.

Step4: Choose price charts and indicators to analyze——Choose the candles to take advantage of candlestick patterns. There are 7 types of price charts to allow you to choose a graphic that appeals most to your trading plan. Mitrade also offers hundreds of indicators to refine your technical analysis.

Step5: Open short or long positions——Simply click on the red “sell “ button to enter the sell trade. If you believe the instrument value will go up, press the "green button” to open a buy position.

Practice your trading skills with a demo account!
Final Words
Trading forex is simple but not easy. It requires a winning strategy. Some of the successful trading strategies are based on candlestick patterns. Candlesticks are more visual and provide an effective method of analyzing financial markets. In fact, the patterns are based on historical price data enabling trades to gauge the market and detect ideal trading opportunities. Traders get valuable insights into potential trend reversal, continuation, and breakouts. If you want to understand how to trade profitably with candlestick patterns, this guide will help you get started. Start learning and practicing on the Mitrade trading platform, and you will be a pro before you know it.
* The content presented above, whether from a third party or not, is considered as general advice only. This article should not be construed as containing investment advice, investment recommendations, an offer of or solicitation for any transactions in financial instruments.
- Original
- Trading Analysis

Risk Warning: Trading may result in the loss of your entire capital. Trading OTC derivatives may not be suitable for everyone. Please consider our legal disclosure documents before using our services and ensure that you understand the risks involved. You do not own or have any interest in the underlying assets.


.jpg)
.png)


